

The era of the 'last-click' silo is effectively over. If you're still judging your Meta or TikTok spend solely by the conversions tracked in their respective dashboards, you're likely underfunding your most potent customer acquisition engine. Data from major performance agencies suggests that for every dollar attributed directly to social, there is often a 20% to 45% uplift in branded search volume that goes uncredited to the social team. This is the 'halo effect'—the phenomenon where top-of-funnel awareness drives users to complete their journey via a search engine.
You've seen the symptoms: search ROAS spikes when social budgets are high and craters when you pause your Reels campaigns. Yet, proving this relationship to a CFO who only trusts GA4 last-click data remains the industry's greatest hurdle. By the end of this guide, you will have a repeatable framework for measuring this cross-channel interaction using incrementality testing and geographic lift studies. You'll move beyond 'correlation' and start talking about 'causality.'
Before You Start: The Prerequisites
Before executing this framework, ensure you have the following in place:
- Clean Search Data: At least six months of historical branded search spend and conversion data from Google Ads.
- Social Spend Stability: A consistent baseline of spend on Meta, TikTok, or LinkedIn for at least 30 days.
- Testing Budget: A surplus of 10-15% of your monthly social budget to fund the 'test' cells.
- Geographic Granularity: The ability to segment your ad delivery by DMA (Designated Market Area) or state.
TL;DR: Key Takeaways
- Social creates demand; Search captures it. Last-click attribution ignores the 30% of users who see a social ad but convert later via Google.
- Incrementality is the gold standard. Use geo-testing (splitting markets into 'Test' and 'Control') to isolate social's impact on search volume.
- Focus on Branded Search ROAS. The halo effect is most visible in branded queries where intent was sparked by specific social creative.
Step 1: Establish Your Branded Search Baseline
You cannot measure a lift if you don't know your floor. The halo effect primarily manifests as an increase in branded search queries—users who saw your ad, remembered your name, and searched for you later.
Start by isolating your branded search campaigns in Google Ads. You need to calculate your 'Natural Search Velocity.' This is the volume of branded clicks and conversions you receive when social spending is at its absolute minimum. Look at periods like the post-holiday slump or Q1 budget resets. According to recent insights from Google's Marvin Clarifies AI Search, the search landscape is shifting toward generative results, making it even more vital to capture branded intent before it gets diverted to AI summaries.
What to do: Export daily branded search impressions, clicks, and conversions for the last 180 days. Map this against your daily paid social spend. You aren't looking for a perfect line; you're looking for the lag. Does a spike in TikTok spend on Monday lead to a branded search surge on Wednesday?
Why it matters: Establishing this baseline prevents you from misattributing organic growth to social. It allows you to say, "We expect 1,000 branded conversions per week; anything above this during our social flight is the potential halo."
Common Pitfall: Including 'Generic' or 'Category' search terms in your baseline. The halo effect for generic terms (e.g., "best running shoes") is much harder to isolate than for branded terms (e.g., "Nike Pegasus"). Keep your baseline strictly focused on your brand name and its variations.
Step 2: Design a Geographic Split Test (Geo-Lift)
Since Apple's iOS 14.5 update, user-level tracking has become a sieve. The most robust way to measure the halo effect now is through Geographic Split Testing. This involves selecting two sets of markets that behave similarly and turning social ads 'on' in one and 'off' (or at baseline) in the other.
What to do: Select 10-20 DMAs that have similar historical conversion rates and population sizes. Split them into two groups: 'Cell A' (Control) and 'Cell B' (Test).
- Cell A: Maintain your current social spend levels.
- Cell B: Increase social spend by 50-100% for a period of 4 weeks.
During this time, do not change your search strategy. Keep your Google Ads bids and budgets consistent across both regions. You are looking for a divergence in Search ROAS between the two groups.
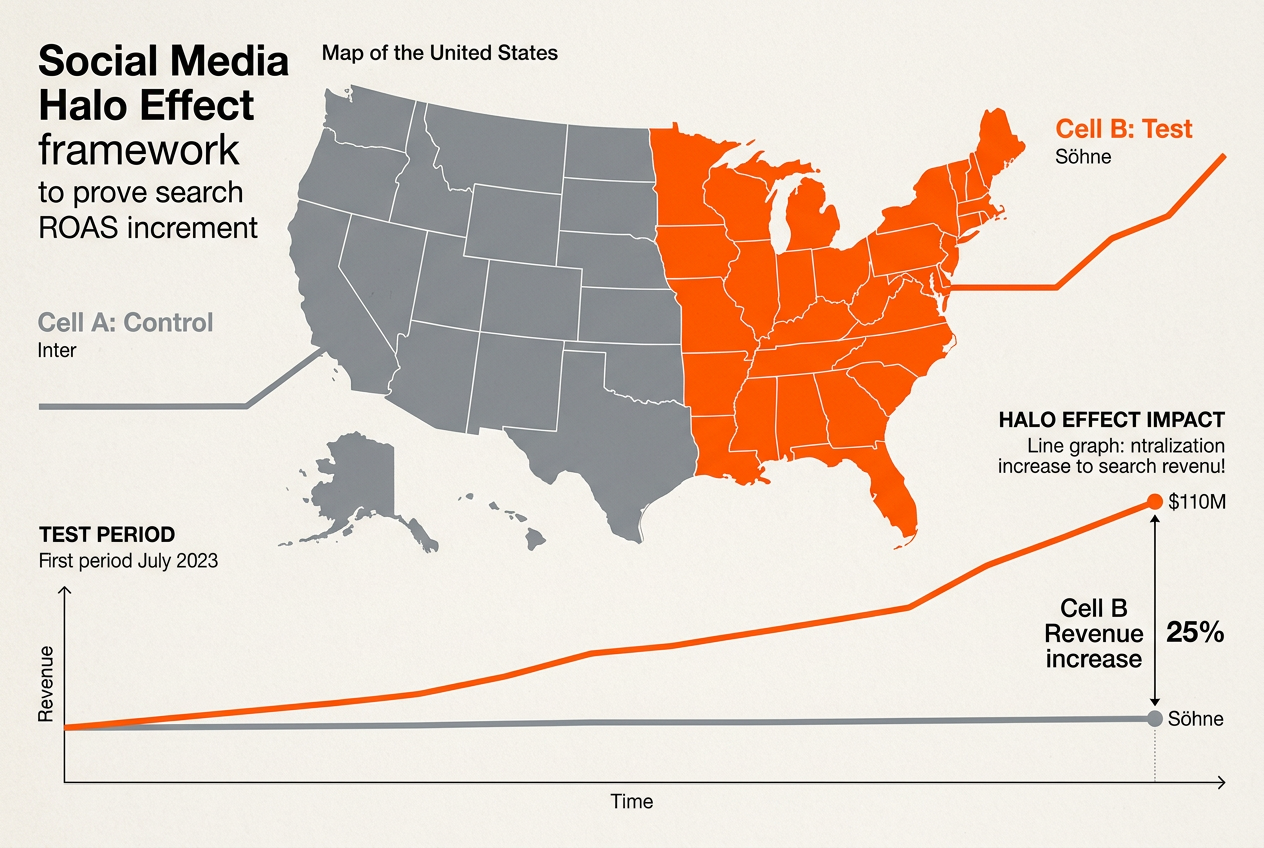
Why it matters: This method bypasses the need for cookies or pixels. If Cell B sees a 15% higher Search ROAS than Cell A, and the only difference was the social spend, you have mathematically proven incrementality. This is exactly how brands like the MLS are approaching their massive World Cup campaigns, as noted in MLS Marketing Strategy, ensuring that every dollar spent on broad awareness can be tracked to ticket search intent.
Common Pitfall: Contaminating the test by running other localized promotions (like OOH or radio) in only one of the test cells. Ensure all other marketing variables remain constant across both geographies.
Step 3: Align Social Creative with Search Keywords
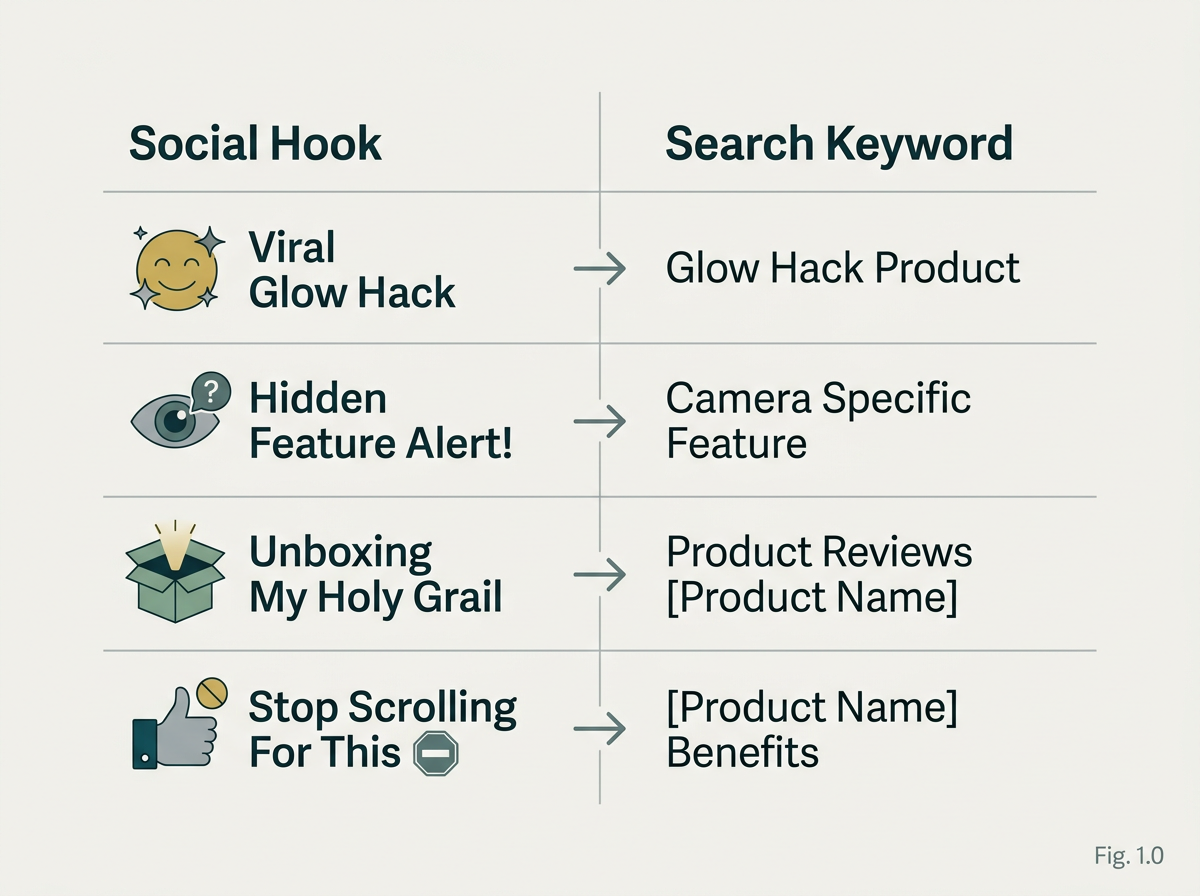
The halo effect isn't magic; it's memory. If your social ad uses the phrase "Summer Glow Kit" but your search ads focus on "Anti-Aging Serums," the user journey is fractured. To maximize the halo, you must synchronize your creative 'hooks' with your search 'bids.'
What to do: Review your top-performing social ad copies from the last 30 days. Identify the specific nouns and adjectives that are driving high engagement rates. Immediately add these terms as 'Exact Match' keywords in your branded search campaigns.
For example, if a TikTok creator goes viral using the term "The Pillow Slide Hack," you should be bidding on that exact phrase in Google. As we see in the rise of TikTok Marketing Agencies, the brands winning today are those that treat social as a focus group for search intent.
Why it matters: This reduces friction. When a user sees a specific term on Instagram and then sees that same term in a Google Headline, the CTR (Click-Through Rate) on search typically increases by 10-15%. Higher CTR leads to better Quality Scores, which lowers your CPC and raises your ROAS.
Common Pitfall: Failing to update your search ad extensions. If your social ad is promoting a 20% off sale, but your Google Sitelinks still point to a clearance page, you're losing the momentum social created.
Step 4: Calculate the Incrementality Multiplier
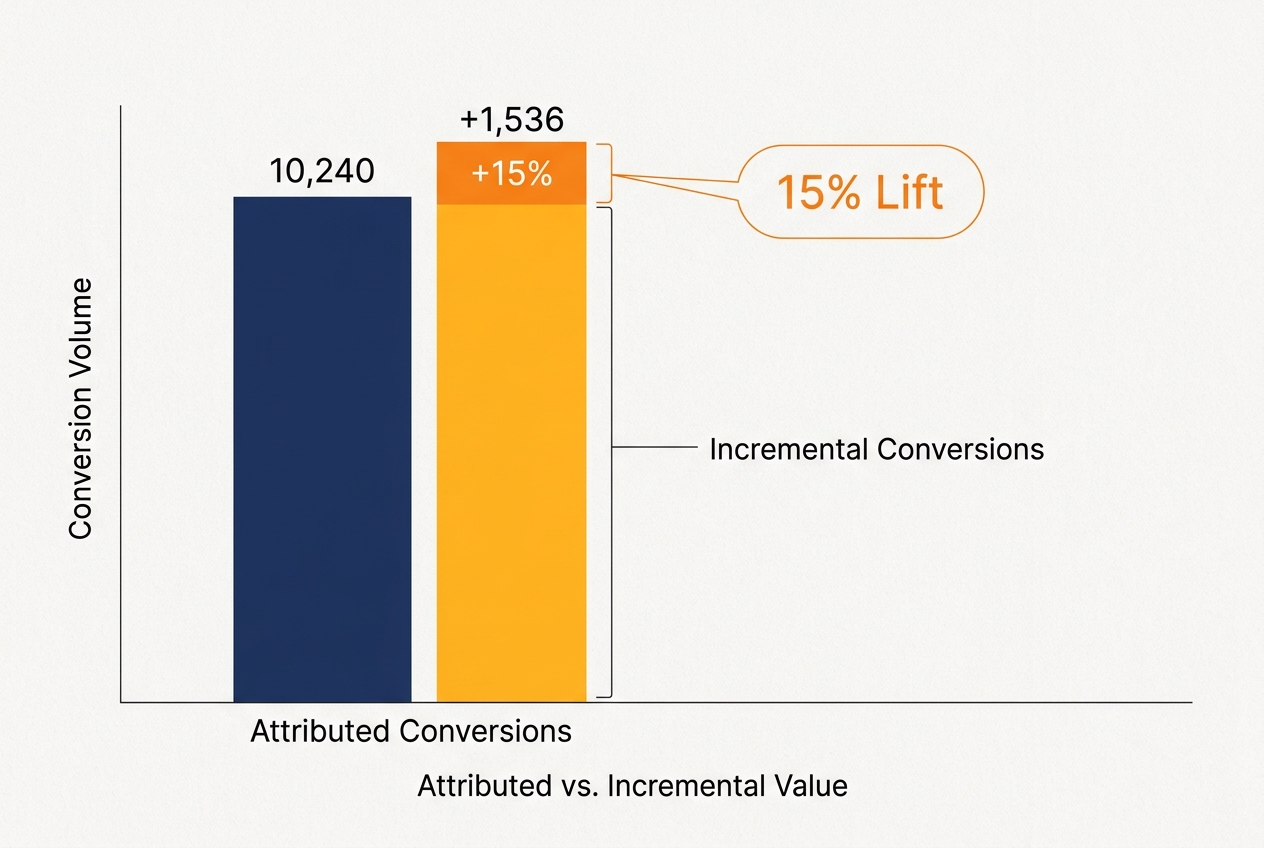
Once your geo-lift test is complete, it's time to do the math. You are looking for the 'Incremental Search ROAS.' This is the revenue generated in search that would not have happened without the social spend.
What to do:
Use this formula:
Incremental Revenue = (Revenue in Test Cell - Revenue in Control Cell) / Control Revenue
If your Test Cell (high social spend) produced $120,000 in search revenue and your Control Cell (normal spend) produced $100,000, your lift is 20%. You can then attribute that $20,000 directly back to the extra social spend. If you spent $5,000 extra on social to get that $20,000 in search revenue, your 'Social-to-Search ROAS' is 4.0x.
Why it matters: This number is your shield during budget meetings. When the social dashboard shows a 1.2x ROAS (which looks bad), you can now add the 4.0x search lift to the equation. Your 'Blended ROAS' becomes the metric of truth.
Common Pitfall: Ignoring the 'decay' period. The halo effect doesn't stop the second you turn off the ads. Users often search 7-14 days after seeing an ad. Ensure your measurement window includes a 'cool-down' period of at least two weeks after the test concludes.
Step 5: Verify via Conversion Lift Studies
To validate your geo-testing, run a platform-native Conversion Lift Study (available on Meta and TikTok). These studies use a randomized control group at the user level rather than the geographic level.
What to do: Set up a 'Multi-Cell' lift study. Cell 1 receives your standard creative. Cell 2 receives nothing. The platform will track how many people in each group eventually converted on your website, regardless of whether they clicked the ad.
Compare the results of the platform's lift study with your geo-lift data. If both show a similar percentage of 'untracked' conversions, you have achieved statistical significance. This is the 'Verification' step that proves your model isn't a fluke. As discussed in the context of GEO Investment Attribution, you don't need perfect attribution to prove value, but you do need directional consistency across different testing methodologies.
Why it matters: Platform lift studies capture the 'View-Through' conversions that Google Analytics often misses. When combined with your search data, you get a 360-degree view of the user journey.
Common Pitfall: Running a lift study with too small a sample size. You typically need at least 500 conversions per cell for the data to be statistically significant. If your volume is lower, stick to geo-testing.
Three Tactics to Try Next
Once you've mastered the basic halo measurement, refine your strategy with these advanced moves:
- Sequential Retargeting on Search: Use RLSA (Remarketing Lists for Search Ads) to bid more aggressively on generic keywords only for users who have previously visited your site via a social ad. This allows you to 'buy' category terms profitably because you've already warmed up the lead on social.
- The 'Social-First' Landing Page: Instead of sending search traffic to a standard product page, send them to a page that mirrors the aesthetic of the social ad they likely saw. Use UGC (User Generated Content) and vertical video formats on the landing page to maintain the 'social' feel.
- Cross-Channel Budget Fluidity: Move away from fixed monthly budgets for social and search. Instead, use a 'Maximum Blended CPA' target. If search ROAS is high because social is killing it, keep the social spend flowing even if its direct ROAS looks soft.
By treating paid social as a demand-generation tool and search as a demand-capture tool, you stop fighting over attribution and start focusing on growth. The halo effect isn't a mystery—it's a measurable, predictable, and exploitable part of the modern marketing mix.
FAQ