
Vanity metrics are the comfort food of social media management—satisfying in the moment, but they offer zero nutritional value for a brand’s bottom line. You’ve seen the reports: high view counts, thousands of likes, and a healthy subscriber growth curve. Yet, when the CFO asks how many of those 500,000 views on your latest product showcase actually resulted in a checkout on Shopify, the room goes quiet.
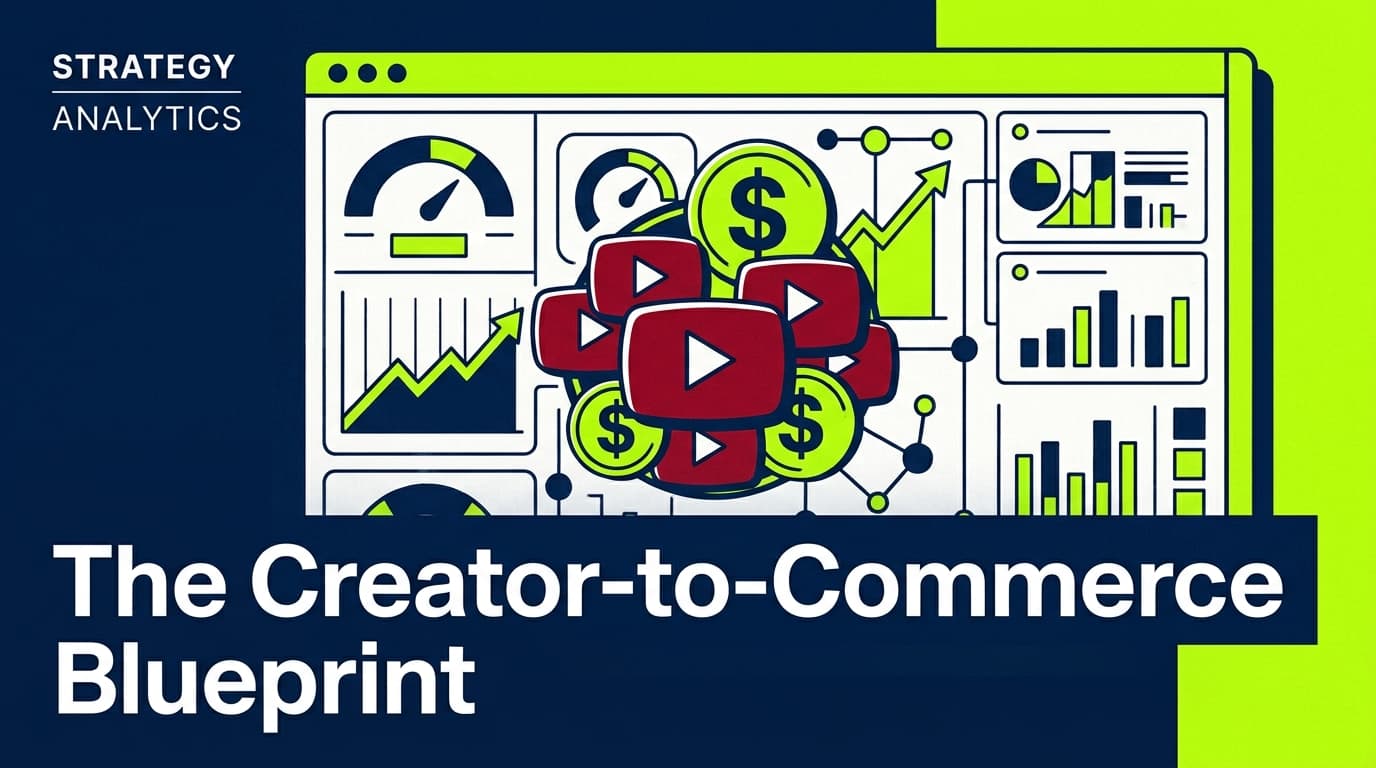
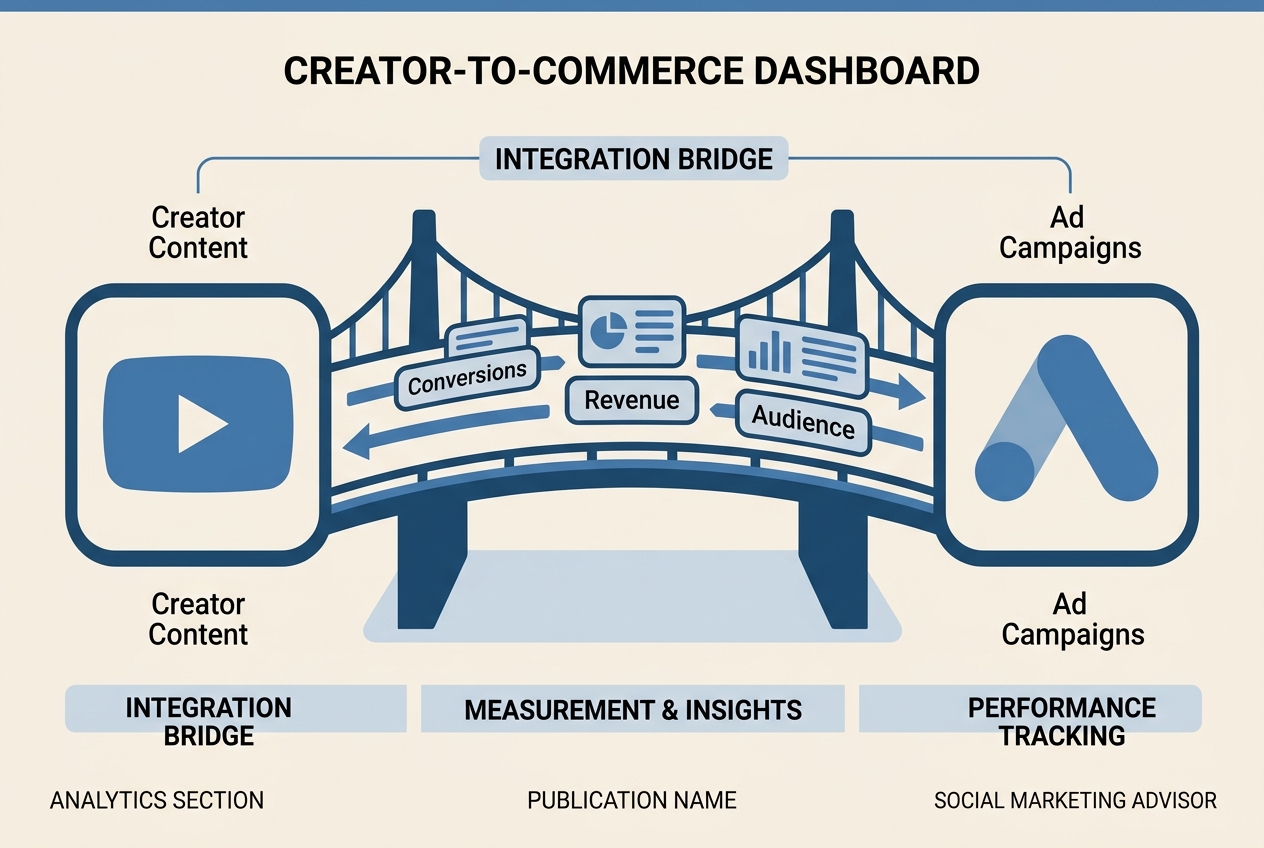
The problem isn't a lack of data; it's the fragmentation of it. You’re likely jumping between the YouTube Studio mobile app for engagement, Google Analytics 4 for web traffic, and the Shopify admin for sales. This guide fixes that. We are going to build a unified commerce dashboard directly within YouTube Studio’s Advanced Mode. By the end of this process, you will be able to see exactly how your video content drives new customer acquisition and revenue, utilizing the latest Google Ads reporting features and custom metric mapping.
Before we start, ensure you have administrative access to your brand’s YouTube channel, an active Google Ads account linked to that channel, and a GA4 property with Enhanced Ecommerce enabled.
TL;DR
- Link Accounts: Connect Google Ads and YouTube Studio to enable deep-funnel data flow.
- Custom Metrics: Use 'Advanced Mode' to create calculation-based columns for ROAS and CAC.
- New Customer Acquisition: Leverage Google’s August 2026 reporting update to isolate first-time buyers.
- Verification: Cross-reference UTM-tagged referral traffic with YouTube’s internal 'Traffic Source' reports.
Step 1: Bridge the Data Gap via Google Ads Integration
You cannot build a commerce dashboard in YouTube Studio if the platform doesn't know what happens after the click. The first step is establishing a bidirectional data flow between your video content and your conversion engine. While many marketers stop at linking the accounts for ad placement, we are doing it for reporting granularity.
Go to your YouTube Studio settings, navigate to 'Channel,' and then 'Advanced Settings.' Under the Google Ads account linking section, ensure your primary merchant ID is connected. This is critical because, as of the August 2026 update to Google Ads [S1], the platform now offers dedicated reporting for new customer acquisition. By linking these, YouTube Studio can begin to ingest conversion signals that were previously siloed in the Ads manager.
Why it matters: Without this link, YouTube views are just an awareness metric. Once linked, Google’s 'New Customer' reporting allows you to see if a specific video is attracting fresh blood to your brand or just preaching to the choir. This is especially relevant given the recent industry shifts toward transparency following the Nielsen and DoubleVerify merger [S3], where verified reach and conversion are becoming the only currencies that matter.
Common Pitfall: Many managers link the wrong Google Ads CID (Customer ID). If you are part of a larger agency structure, ensure you are linking the specific sub-account that handles the conversion pixels for your e-commerce site, not the top-level manager account.
Step 2: Configure Advanced Mode Custom Columns
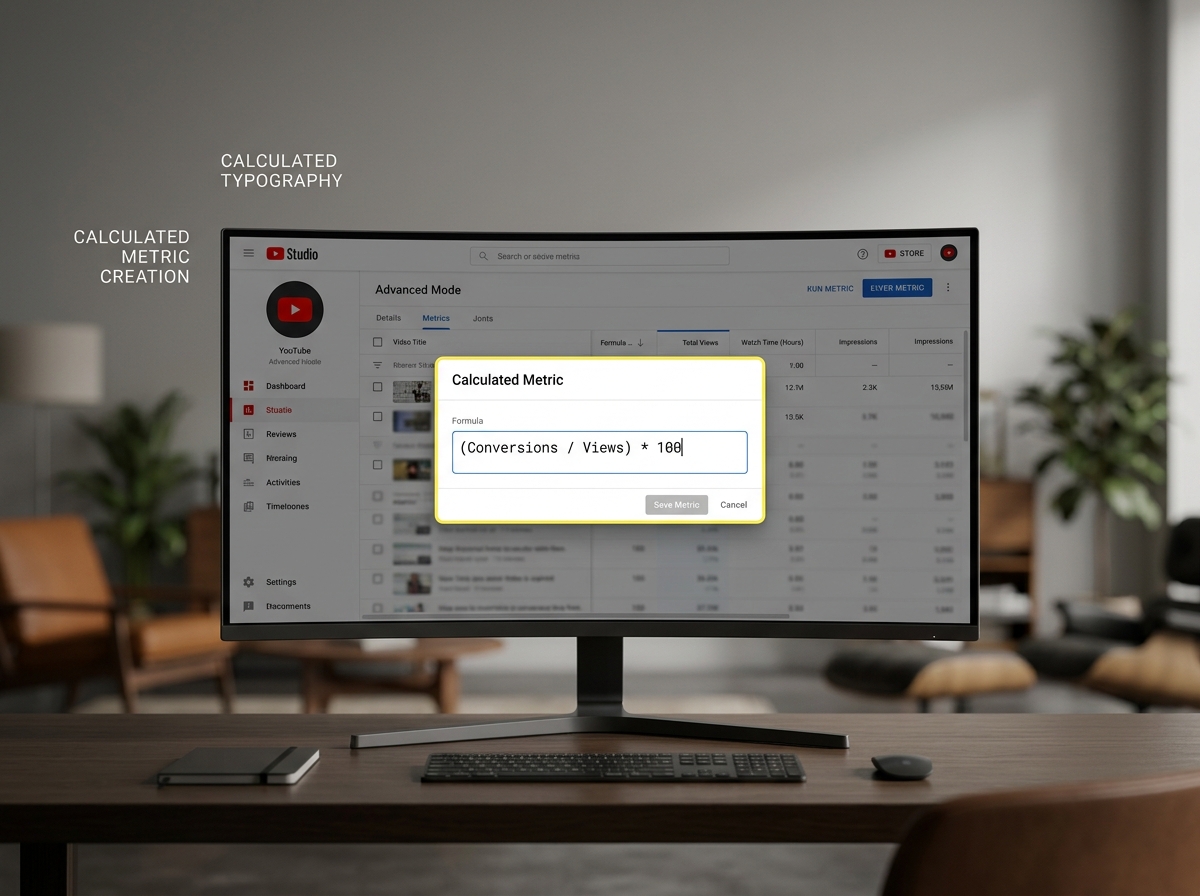
YouTube Studio’s standard dashboard is designed for creators, not commerce leads. To get the view you need, you must enter 'Advanced Mode' in the Analytics tab. This is where the magic happens. Look for the '+' icon next to your columns—this is your gateway to custom metric creation.
We are going to build three specific columns: Commerce Conversion Rate (CVR), Attributed Revenue, and Customer Acquisition Cost (CAC).
To do this, you will use the 'Add Metric' function. Select 'Calculated Metric.' For CVR, your formula will be (Conversions / Views) * 100. For Attributed Revenue, you will pull the 'Conversion Value' data synced from your Google Ads account. This allows you to see, at a glance, which video titles are your high-performers for sales, not just clicks.
Why it matters: This moves your reporting from 'Did they watch?' to 'Did they buy?'. In a landscape where YouTube is testing new formats like static image ads during horizontal playback [S2], understanding how different creative formats contribute to the final sale is paramount. You need to know if that static overlay drove a cheap click or a high-value purchase.
Common Pitfall: Forgetting to set the attribution window. If your product has a long consideration cycle (e.g., high-end electronics), a 1-day click-through window will make your YouTube ROI look abysmal. Set your attribution to at least 30 days to capture the full impact of your video content.
Step 3: Map External Referral Traffic with UTM Parameters
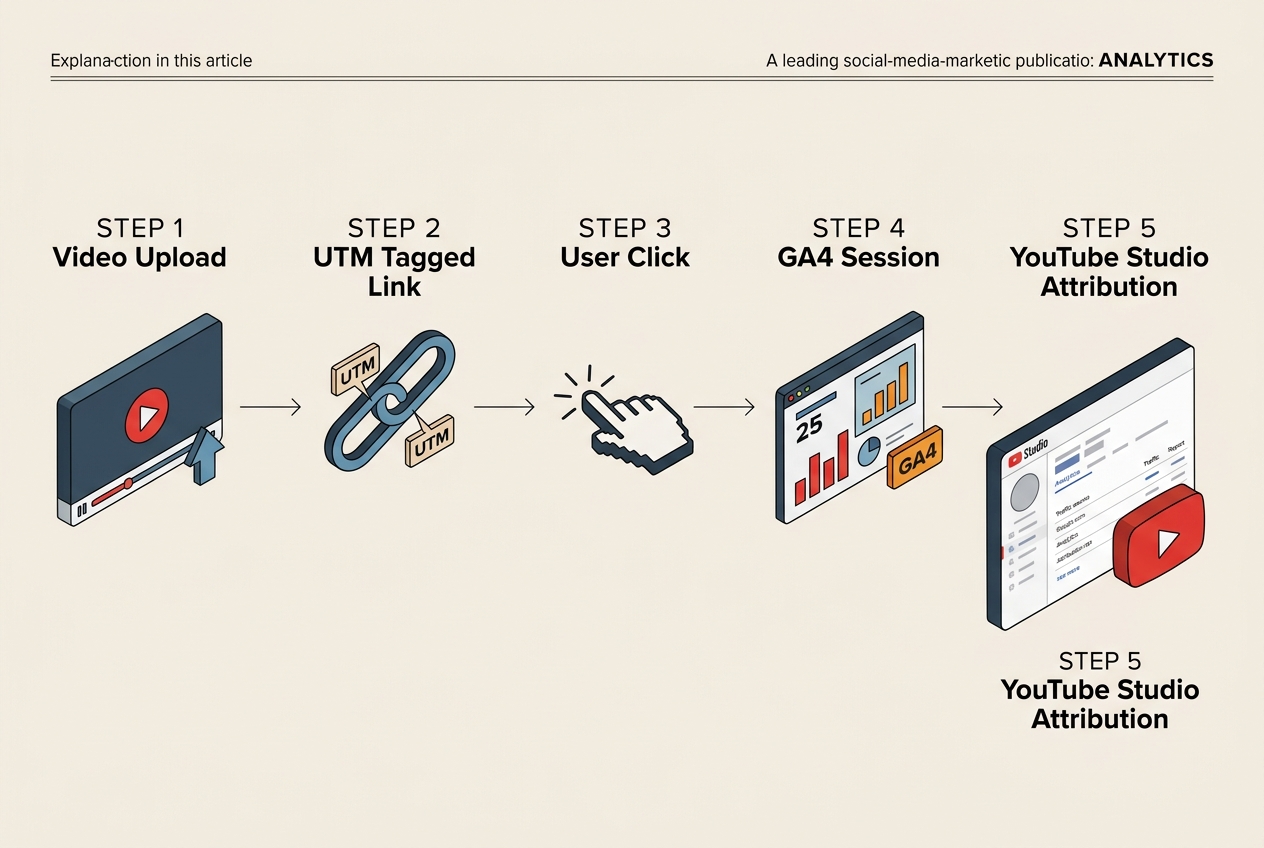
YouTube’s internal 'Traffic Source' report is excellent at telling you how people found your video, but it’s historically poor at telling you where they went next if they clicked a link in your description. To fix this, we implement a strict UTM tagging protocol that matches your YouTube Studio custom segments.
Every link in your video description, pinned comment, and 'About' tab must use a specific UTM structure. For example: utm_source=youtube&utm_medium=social&utm_campaign=product_launch&utm_content=video_id.
Back in YouTube Studio, you can now create a 'Custom Group' of videos based on these campaign tags. By filtering your analytics by these groups, you can see how specific product categories are performing across your entire channel history. This allows you to compare the 'Summer Collection' videos against the 'Winter Collection' without manual spreadsheet exports.
Why it matters: It provides a clean data set for your GA4 'Social Referral' reports. When your YouTube Studio dashboard shows 5,000 clicks and your GA4 shows 5,000 sessions from the same UTM, you have achieved data parity. This level of accuracy is what separates professional brand strategists from amateur creators.
Common Pitfall: Using different UTM conventions for the description link vs. the pinned comment. If you don't differentiate them (e.g., utm_content=desc_link vs utm_content=pinned_comment), you lose the ability to optimize your call-to-action placement.
Step 4: Leverage the 'New Customer' Reporting Layer
Following the August 7, 2026 update [S1], Google Ads has simplified how we track new customer acquisition. In your YouTube Studio Commerce Dashboard, you can now add a column for 'New Customers.' This uses Google’s AI-driven detection to identify users who haven't purchased from your site in the last 540 days.
In the 'Advanced Mode' filter, select 'New Customers' as a secondary metric. This will overlay a purple line (by default) on your revenue charts. If you see your revenue climbing but the 'New Customer' line staying flat, your YouTube strategy is effectively a retention play. If both are climbing, you’ve found a successful acquisition engine.
Why it matters: Acquisition is always more expensive than retention. If your YouTube channel is primarily serving existing customers, you might be overpaying for those views. Conversely, if a specific creator collaboration is bringing in 80% new customers, that creator is worth a premium on their next contract. This data gives you the leverage needed for budget negotiations.
Common Pitfall: Not excluding existing customers from your 'New Customer' bidding logic in the linked Google Ads account. If the settings aren't mirrored, your YouTube Studio report will show inflated acquisition numbers.
Step 5: Integrating Shorts and Long-form ROI
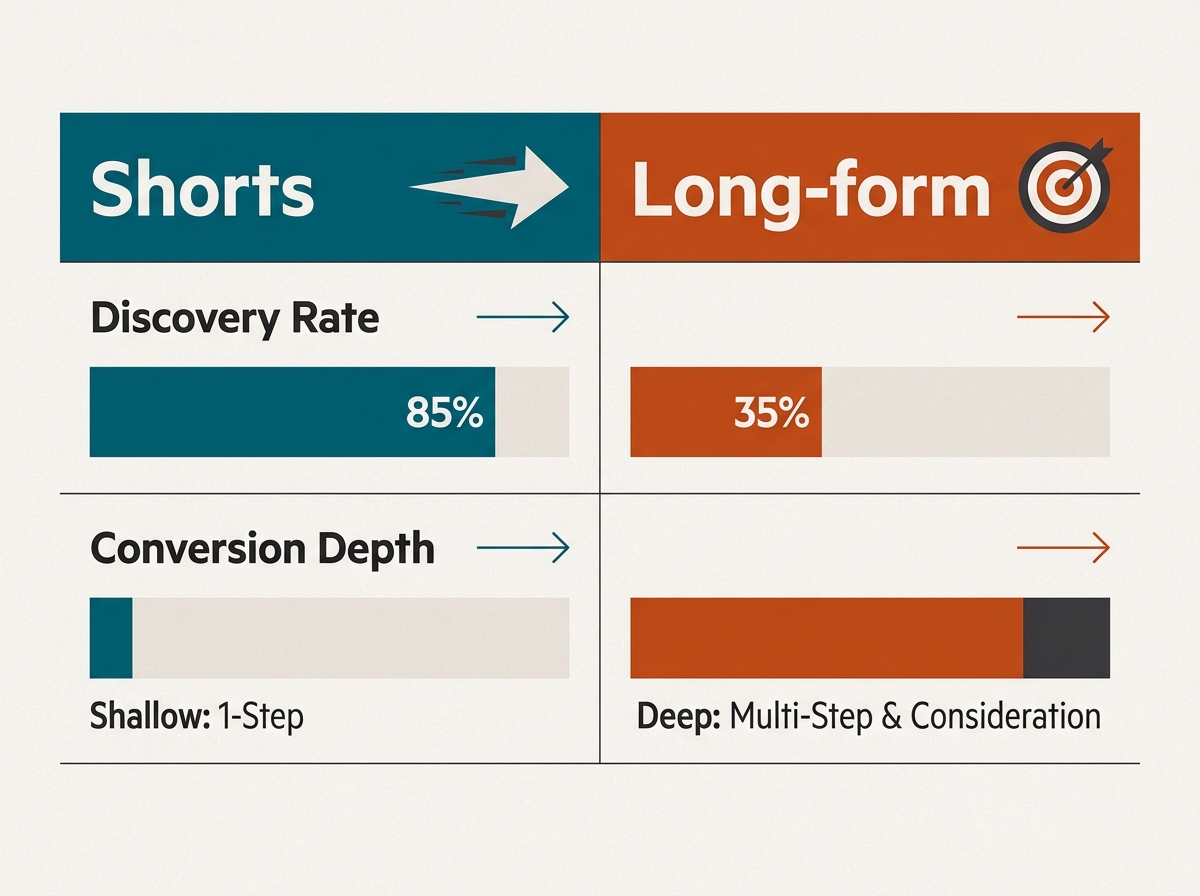
One of the biggest challenges in YouTube marketing ROI is the discrepancy between Shorts and long-form content. Shorts drive massive reach but often have lower conversion intent. Long-form builds deep trust but has a higher barrier to entry. Your dashboard needs to reflect this reality.
In your custom dashboard, create two 'Comparison' views. Group A should be all content with a duration under 60 seconds (Shorts). Group B should be everything over 10 minutes. Compare the 'Cost Per Conversion' between these two groups.
What you will likely find—and what the data from major agencies like Sprout Social suggests—is that Shorts act as the 'Discover' phase of the funnel, while long-form acts as the 'Convert' phase. By seeing them side-by-side in your custom YouTube Studio view, you can stop blaming Shorts for not selling and start valuing them for the traffic they feed into your long-form 'closers.'
Why it matters: It prevents you from making the short-sighted decision to cut Shorts production because of a low direct ROI. If you can see that viewers who watch a Short are 40% more likely to watch a long-form video within 48 hours, the value of the Short is proven.
Common Pitfall: Comparing raw view counts. A Short with 1 million views and 10 sales is often less valuable than a long-form video with 10,000 views and 100 sales. Your dashboard must prioritize 'Revenue Per Mille' (RPM) over 'Views.'
Step 6: Verification and Data Integrity Audit
Before you present these findings to your leadership team, you must verify the integrity of the data. The 'single source of truth' is a myth in digital marketing; what we look for is 'directional alignment.'
To verify your dashboard, pick your top-performing video from the last 30 days. Note the 'Attributed Revenue' in your new YouTube Studio column. Now, go to Google Analytics 4 and filter by the specific UTM content tag for that video. Finally, check your e-commerce backend (Shopify/BigCommerce) for orders tagged with that specific referral code.
If the numbers are within a 10-15% margin of each other, your dashboard is calibrated. Discrepancies larger than that usually point to an issue with cookie consent banners or cross-device tracking limitations—realities of the post-iOS-14 landscape that every strategist must account for.
Why it matters: If you present unverified data, you lose credibility the moment a stakeholder spots a mismatch. Verification ensures you can explain the why behind the numbers, including the expected gaps caused by privacy regulations.
Common Pitfall: Forgetting to account for currency conversions if you sell globally. YouTube Studio might report in USD while your Shopify store reports in EUR, leading to a perceived discrepancy that is actually just an exchange rate issue.
What to do next: Scaling your Commerce Insights
Now that your dashboard is live, don't just let it sit there. Use the data to aggressively pivot your creative strategy. Data without action is just trivia.
- A/B Test Thumbnails for CVR, not CTR: Use your new dashboard to see which thumbnail styles lead to more sales, not just more clicks. You might find that 'clickbaity' thumbnails have a high bounce rate, while 'product-focused' thumbnails have a lower CTR but a 3x higher conversion rate.
- Optimize End Screens for High-Margin Products: Identify your videos with the highest 'Earned Views' (people who watched another video after the first one). Place end-screen elements for your highest-margin products on these specific videos to maximize the value of an engaged viewer.
- Creator Whitelisting based on CAC: If you work with external creators, pull their specific videos into a custom group in your dashboard. Calculate the CAC for each creator. Move your budget away from the 'big names' with high CAC and toward the 'niche experts' who are driving new customers efficiently.
By moving your reporting into YouTube Studio, you are finally meeting the platform where its users are. You aren't just measuring social media; you are measuring a storefront. In an era where Instagram is testing 'Real Time' algorithm customization [S5] and the TV landscape is being reshaped by massive mergers [S4], having a firm grip on your own first-party commerce data is the only way to ensure long-term brand survival.
FAQ