If you're still reporting on Link Clicks in your monthly social deck, you're measuring the sunset of a previous era. The 'walled garden' is no longer a metaphor; it's a structural reality. As of May 2026, TikTok and Instagram have optimized their algorithms to penalize content that attempts to siphon users off-platform. According to recent industry benchmarks, referral traffic from social to external domains has dropped by nearly 40% year-over-year for mid-market brands.
You already know that your social presence drives sales. You see the lift when a video goes viral, even if the UTM-tagged link in your bio remains untouched. The challenge is that your CMO, likely raised on the predictable direct-response mechanics of Google Search, still views social as a top-of-funnel traffic driver. When the traffic stops, they assume the channel is failing.
This guide will teach you how to move beyond the click. By the end of this process, you will have a reporting framework that uses Brandwatch sentiment clusters, geographic lift studies, and search-intent correlation to prove that social isn't just a discovery engine—it's a conversion catalyst that simply refuses to leave a digital paper trail.
TL;DR
- Stop prioritizing CTR: Click-through rates on organic social are now an inverse metric of reach; the more you try to drive traffic, the less the algorithm distributes your content.
- Adopt Incrementality: Use 'dark period' testing or geographic holdouts to measure the real-world sales impact of social spend.
- Measure Sentiment Clusters: Use Brandwatch to track how social conversation shifts brand perception, which correlates to long-term LTV.
- Correlate with Search: Track the delta in branded search volume on Google and Amazon immediately following high-reach social campaigns.
Step 1: Establish Your Baseline Using Branded Search Correlation
Since users aren't clicking your links, they are doing the next best thing: they're opening a new tab and searching for you. This is the 'Zero-Click' conversion path. Your first step is to prove the direct relationship between social impressions and branded search volume.
What to do: Pull your daily reach data from TikTok Shop and Instagram Insights for the last 90 days. Overlay this against your Google Search Console 'Branded Queries' data. Look for the lag time—usually 24 to 48 hours—between a spike in Reels views and a spike in people searching for your specific product names.
Why it matters: This bridge proves that social content creates intent. If a user sees a TikTok about your new skincare line and then searches "[Brand Name] Vitamin C Serum" on Google, social gets 0% credit in a standard Last-Click model. By showing the correlation coefficient between these two data sets, you reclaim that lost attribution.
Common Pitfall: Failing to account for seasonal trends. Ensure you normalize your search data against year-over-year growth to ensure the lift isn't just a result of a holiday weekend or a category-wide trend reported by sources like the Vogue Business TikTok Trend Tracker [S1].
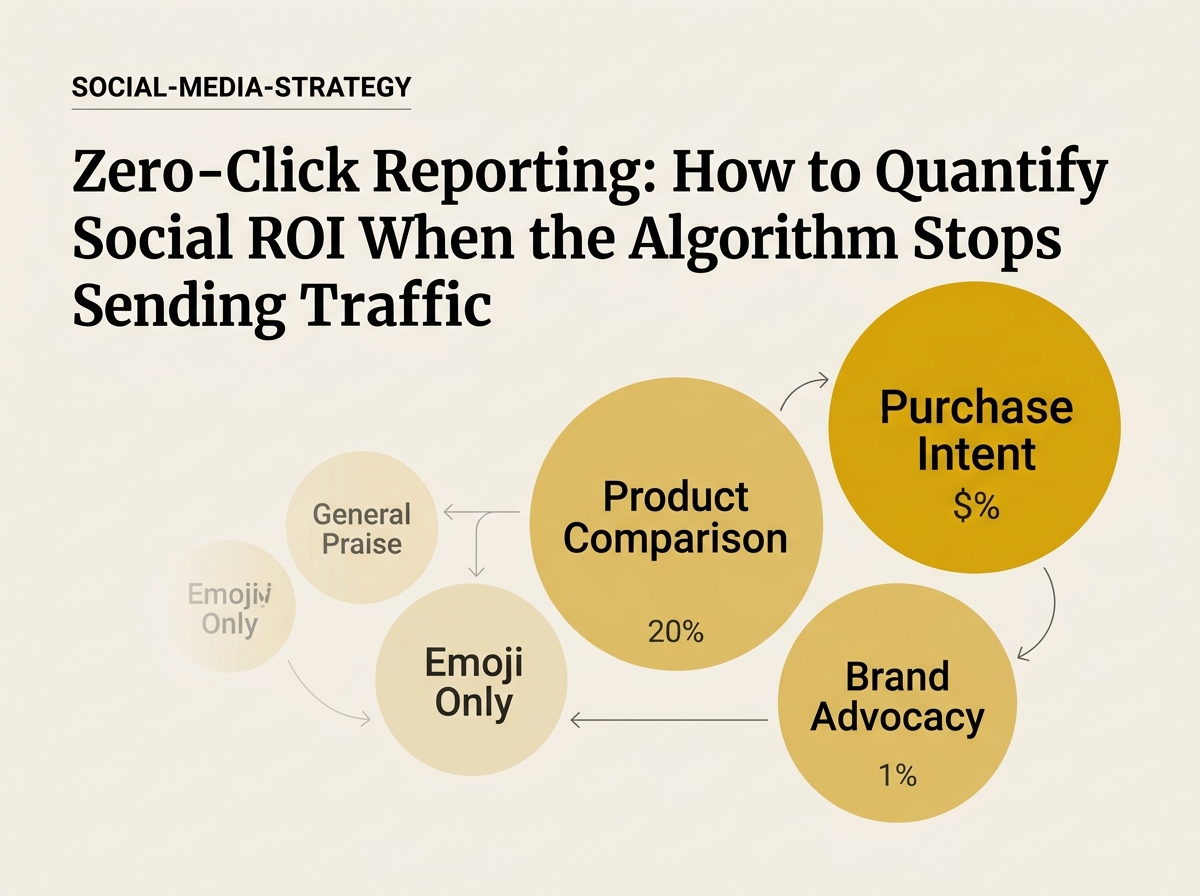
Step 2: Segment Brandwatch Sentiment into 'Purchase Intent' Clusters
Raw engagement (likes and comments) is a vanity metric. To prove ROI, you need to understand the quality of the conversation. You aren't just looking for 'positive' sentiment; you are looking for specific linguistic markers of intent.
What to do: Set up a topic-clustering view in Brandwatch. Instead of broad brand mentions, filter for clusters that include phrases like "need this," "where to buy," "adding to cart," or comparisons against your primary competitors.
Why it matters: A high volume of 'Purchase Intent' clusters is a leading indicator of revenue. When you can show the CMO that social isn't just 'getting likes' but is actively shifting the conversation from 'what is this?' to 'how do I get this?', you are speaking the language of the C-suite. How to master Brandwatch topic clusters
Common Pitfall: Relying on the platform's native 'positive/negative' AI. These are notoriously bad at detecting sarcasm or niche industry slang. You must manually train your clusters for at least two weeks to ensure accuracy.
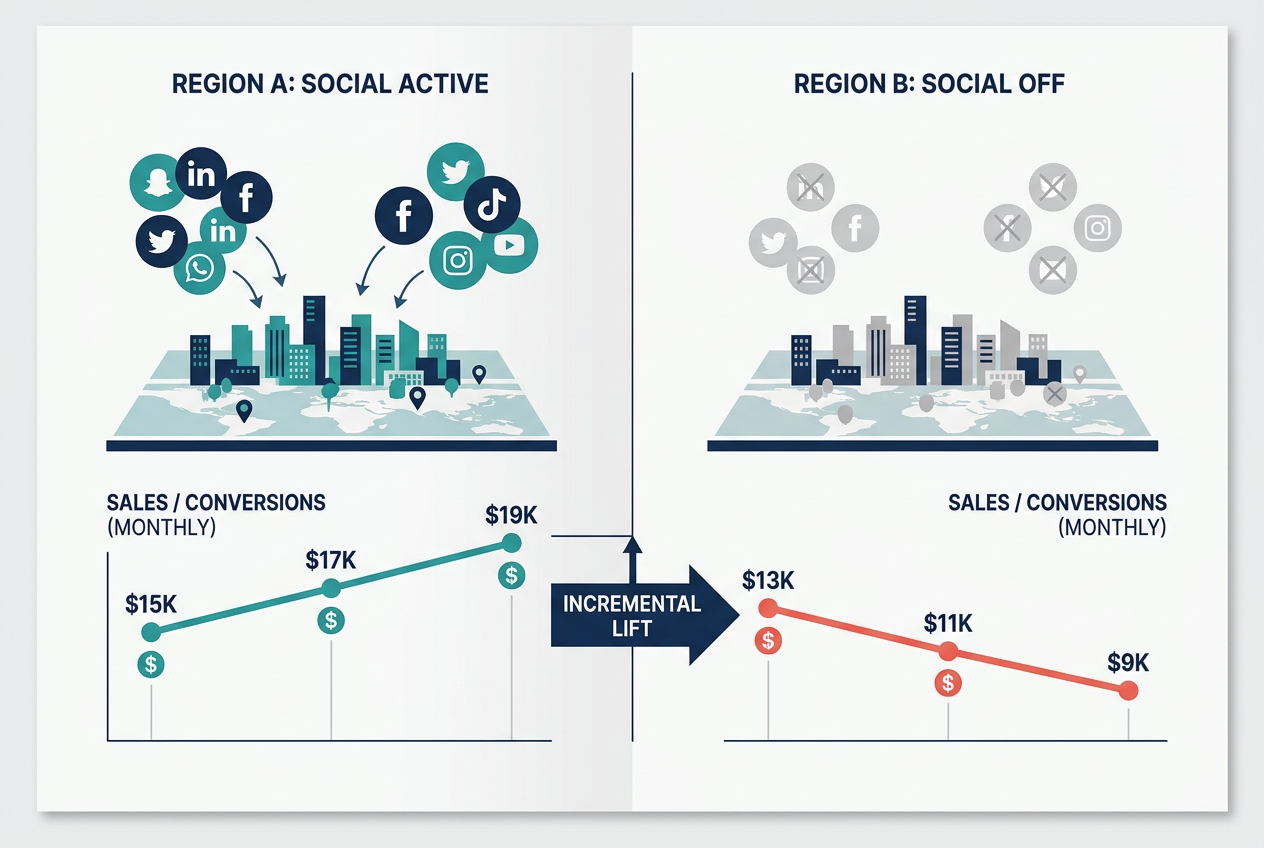
Step 3: Execute a Geographic Lift Study (The Gold Standard)
If you want to end the debate about social ROI, you need to run an incrementality test. This is the most aggressive way to prove that social drives sales, but it requires a temporary 'sacrifice' of reach in specific markets.
What to do: Select two statistically similar geographic regions (e.g., two mid-sized states with similar historical sales). In Region A (the Control), maintain your baseline social activity. In Region B (the Test), completely dark-out all organic and paid social activity for 14 to 21 days.
Why it matters: The difference in total sales between Region A and Region B during this period is your 'Incremental Lift.' If sales in Region B drop by 12% while Region A remains steady, you have definitive proof that social is responsible for that 12% margin, regardless of how many people clicked a link. This bypasses the need for cookies or tracking pixels entirely.
Common Pitfall: Choosing regions that are too small or too influenced by local events. If Region B suddenly has a massive local festival or a natural disaster during your test, your data is junk. Check local news sources like Morning Sentinel [S5] to ensure your test markets remain 'clean' during the study period.
Step 4: Map the 'Social-to-Search-to-Sale' Journey in Your CRM
While we can't track every individual, we can track enough of them to build a representative model. You need to connect your social engagement data to your CRM (like Salesforce or HubSpot) using 'Hand-Raiser' events.
What to do: Create low-friction conversion points that don't require leaving the app, such as Instagram Lead Forms or TikTok Shop inquiries. Use these as 'anchor points' in your CRM. When a lead converts, look at their history—did they sign up for a newsletter via an Instagram ad three weeks before their first direct-site purchase?
Why it matters: This allows you to move from 'probabilistic' modeling (guessing based on trends) to 'deterministic' modeling (knowing for sure). Even if only 5% of your customers follow this trackable path, you can use that 5% as a multiplier to estimate the behavior of the other 95%.
Common Pitfall: Over-valuing the lead form. Just because someone filled out a form doesn't mean they are a high-value customer. You must track these leads through to the final sale to calculate true Customer Acquisition Cost (CAC).
Step 5: Verify Your Model with a 'Post-Purchase Survey' (PPS)
After you have built your correlation models and run your lift studies, you need a reality check. The simplest way to verify zero-click attribution is to ask the customer directly.
What to do: Implement a mandatory one-question survey on your 'Thank You' page: "How did you first hear about us?" Ensure 'TikTok' and 'Instagram' are separate options, and include a 'Search' option as well.
Why it matters: You will consistently find that 30-50% of people who arrived via 'Direct' or 'Organic Search' will actually select 'TikTok' or 'Instagram' as their original discovery source. This is your 'Attribution Gap.' If your PPS says 40% of customers came from social, but your Google Analytics says 4%, your 'Social Multiplier' is 10x. You can now confidently tell your CMO that for every $1 tracked in GA, social is actually generating $10.

Common Pitfall: Offering too many options in the survey. Keep it to 5-6 broad categories. If you give them 20 choices, they will pick the first one just to close the window, ruining your data integrity.
Three Related Tactics to Try Next
Once you have mastered the zero-click reporting framework, you can refine your strategy with these advanced tactics:
- Influencer Whitelisting for Dark Social: Partner with creators to run ads through their handles. This often bypasses the 'commercial' feel of brand ads and can be tracked via unique discount codes, which are the ultimate zero-click attribution tool. The guide to creator whitelisting
- TikTok Shop Integration: If you haven't moved your inventory onto TikTok Shop yet, you are missing out on the only way to get 100% closed-loop attribution within the platform. As Business.com notes, the benefits of Instagram and TikTok for business in 2026 center heavily on these native shopping features [S2].
- SMM Panel Benchmarking: Use high-quality social media marketing platforms to monitor competitor growth rates. While we don't recommend buying engagement, understanding the 'floor' of your industry's reach through tools like those mentioned in Programming Insider [S3][S4] helps you understand if your organic reach is truly 'good' or just average for the current algorithm environment.
By shifting your focus from the 'click' to the 'lift,' you protect your budget and your job. The algorithm isn't going to start sending traffic back to your site anytime soon. Stop waiting for the platforms to change and start changing how you measure them.
FAQ