


Since Apple released iOS 14.5, the industry has been chasing its tail. You've seen the discrepancies: Meta Ads Manager claims 400 conversions while your Shopify backend shows 250 total for the day. Multi-touch attribution (MTA), once the holy grail of digital marketing, has become a hall of mirrors. When cookies crumble and identifiers disappear, the 'last-click' or even 'linear' models we relied on provide a distorted view of reality.
Sophisticated brands are no longer trying to track every individual user through the funnel. Instead, they are returning to a statistical heavyweight: Media Mix Modeling (MMM). By the end of this guide, you will understand how to aggregate your spend and conversion data to build a model that reveals the true incremental impact of your social media budget. You don't need a PhD in statistics, but you do need a clean spreadsheet and a willingness to look at the big picture.
Key takeaways
- MTA is dead: Privacy constraints have rendered individual-level tracking unreliable for long-term budgeting.
- MMM focuses on aggregates: By correlating spend fluctuations with sales volume, you bypass the need for tracking pixels.
- Incrementality is the goal: The model identifies which dollars actually drove new sales versus those that just claimed credit for them.
- Low-code tools exist: You can start with basic regression in Excel or use open-source libraries like Meta's Robyn or Google's LightweightMMM.
Step 1: Cleanse and Aggregate Your Historical Data
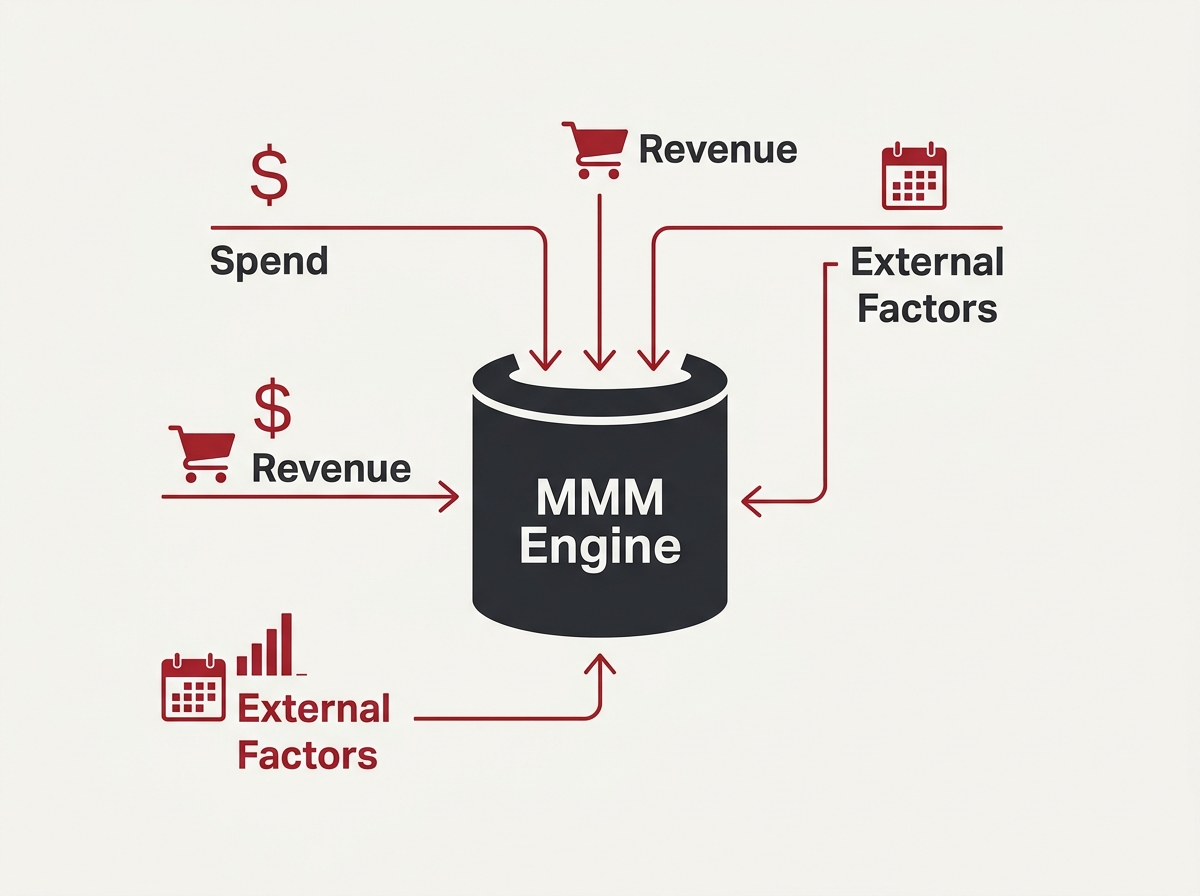
The first step in any Media Mix Model is gathering your inputs. Unlike MTA, which requires granular user IDs, MMM thrives on aggregate numbers. You need at least two years of weekly data to account for seasonality, though 12 months can work for a pilot.
You must collect three categories of data: your dependent variable (usually revenue or total conversions), your independent variables (spend by channel, such as Meta, TikTok, and Search), and your exogenous variables (external factors like holidays, price changes, or economic shifts).
Why it matters: A model is only as good as its inputs. If you don't account for a massive 40% off sale in November, the model will incorrectly attribute that spike in sales to your increased Black Friday ad spend. You need to 'tell' the model that the price drop occurred so it can isolate the effect of the media.
Common pitfall: Marketers often forget to include 'organic' variables. If you had a viral post on LinkedIn or a major PR mention that didn't cost ad dollars but drove traffic, failing to include it will inflate your paid social ROI. Ensure your data includes 'Base' sales—the revenue you would generate even if you spent zero dollars on ads.
Step 2: Define Your Adstock and Diminishing Returns
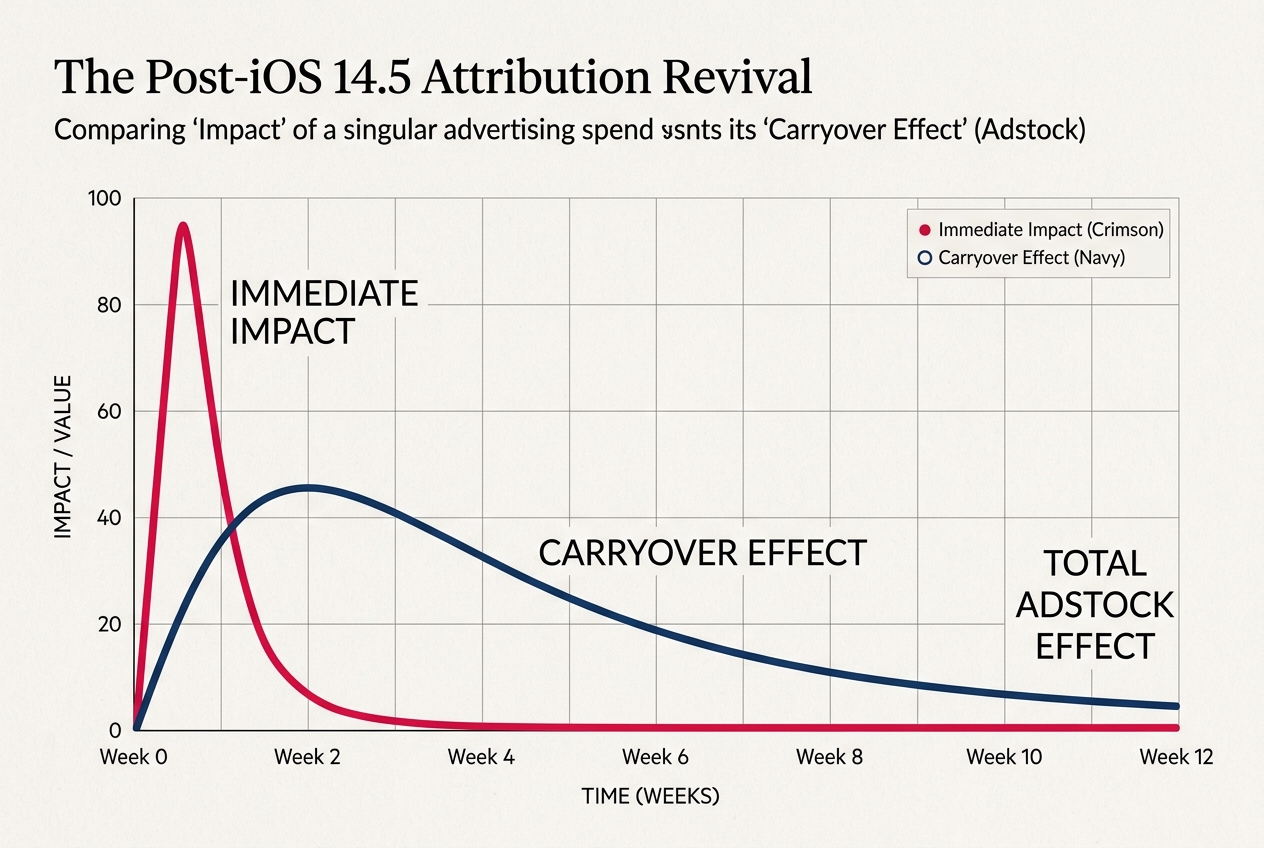
Advertising doesn't work like a light switch. If you spend $10,000 on TikTok today, the sales don't all happen in the next 24 hours. This is known as the 'carryover effect' or Adstock. Similarly, spending $1,000 might get you 10 sales, but spending $1,000,000 won't necessarily get you 10,000 sales. This is the law of diminishing returns.
In your model, you must apply a decay rate to your spend. For social media, which is high-frequency and fast-paced, the decay rate is usually shorter than for TV or Billboard advertising. You are essentially transforming your 'spend' column into an 'effective reach' column that accounts for the lingering impact of your creative.
Why it matters: Without accounting for Adstock, your model will underestimate the value of top-of-funnel awareness campaigns that take weeks to convert. It will overvalue direct-response ads that appear to 'close' the sale immediately.
Common pitfall: Setting an identical decay rate for every channel. Search (PPC) typically has a very low Adstock—people click and buy or they don't. Meta Reels, however, might have a longer tail as the algorithm continues to serve the content to new audiences over several days. Test different decay parameters (0.1 to 0.8) to see which fits your historical sales curve best.
Step 3: Run the Regression and Calculate Contribution
Now you get to the math. You are performing a multivariate linear regression. In simple terms, you are asking the computer: 'When I increase my TikTok spend by X, and all other factors stay the same, how much does my total revenue Y change?'
You can use the Analysis ToolPak in Excel for a basic version, but for a professional result, we recommend using R or Python libraries. Meta’s Robyn is particularly useful because it uses an automated evolutionary algorithm to find the best-fitting model parameters. It handles the Adstock and diminishing returns calculations for you.
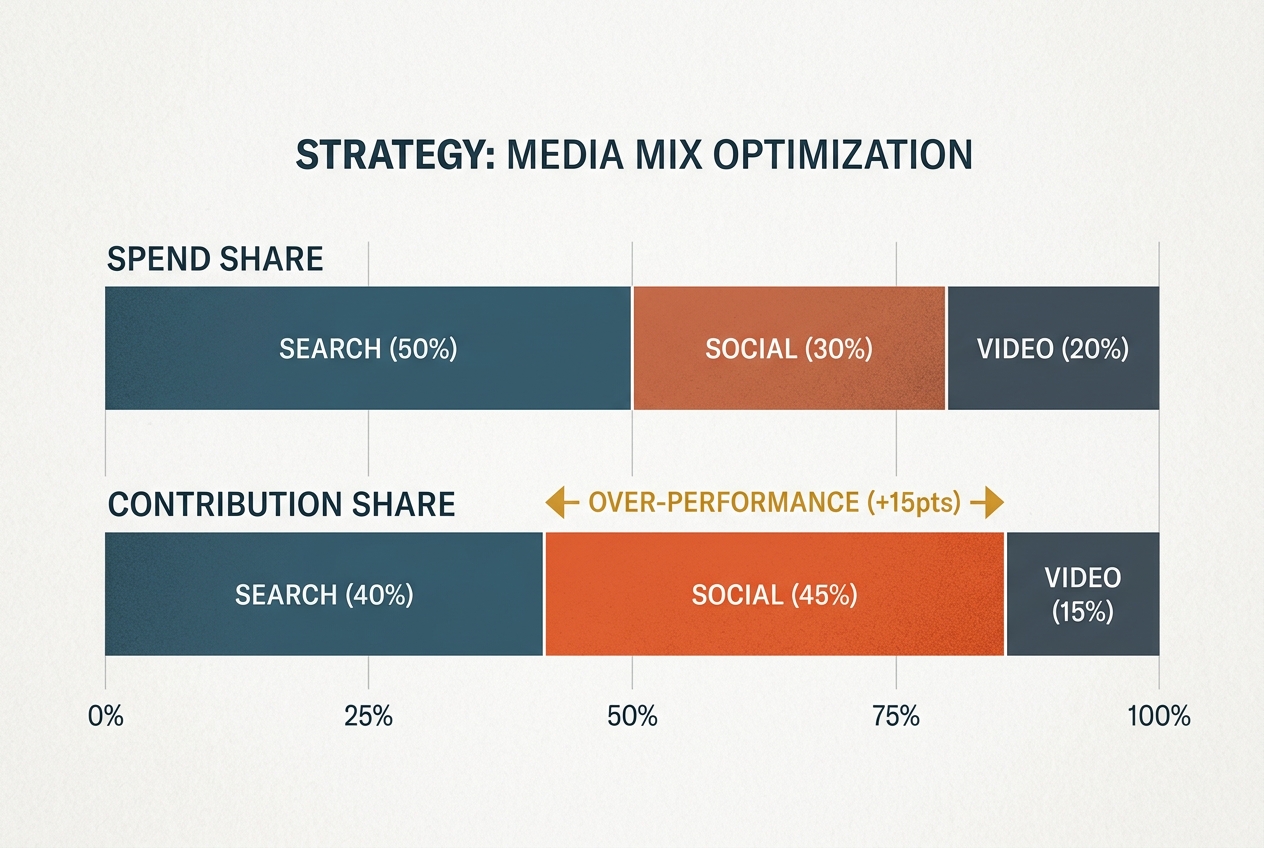
Why it matters: This step moves you from 'correlation' to 'contribution.' The output will give you a 'Contribution Share' for each channel. If Meta accounts for 20% of your spend but 35% of the calculated contribution to revenue, you have a strong case for increasing that budget.
Common pitfall: Overfitting the model. If you include too many variables (like every single sub-campaign name), the model might perfectly match your past data but fail to predict future results. Keep your channel groupings broad (e.g., 'Paid Social', 'Paid Search', 'Influencer') to maintain statistical significance.
Step 4: Validate with Incrementality Testing (Geo-Testing)
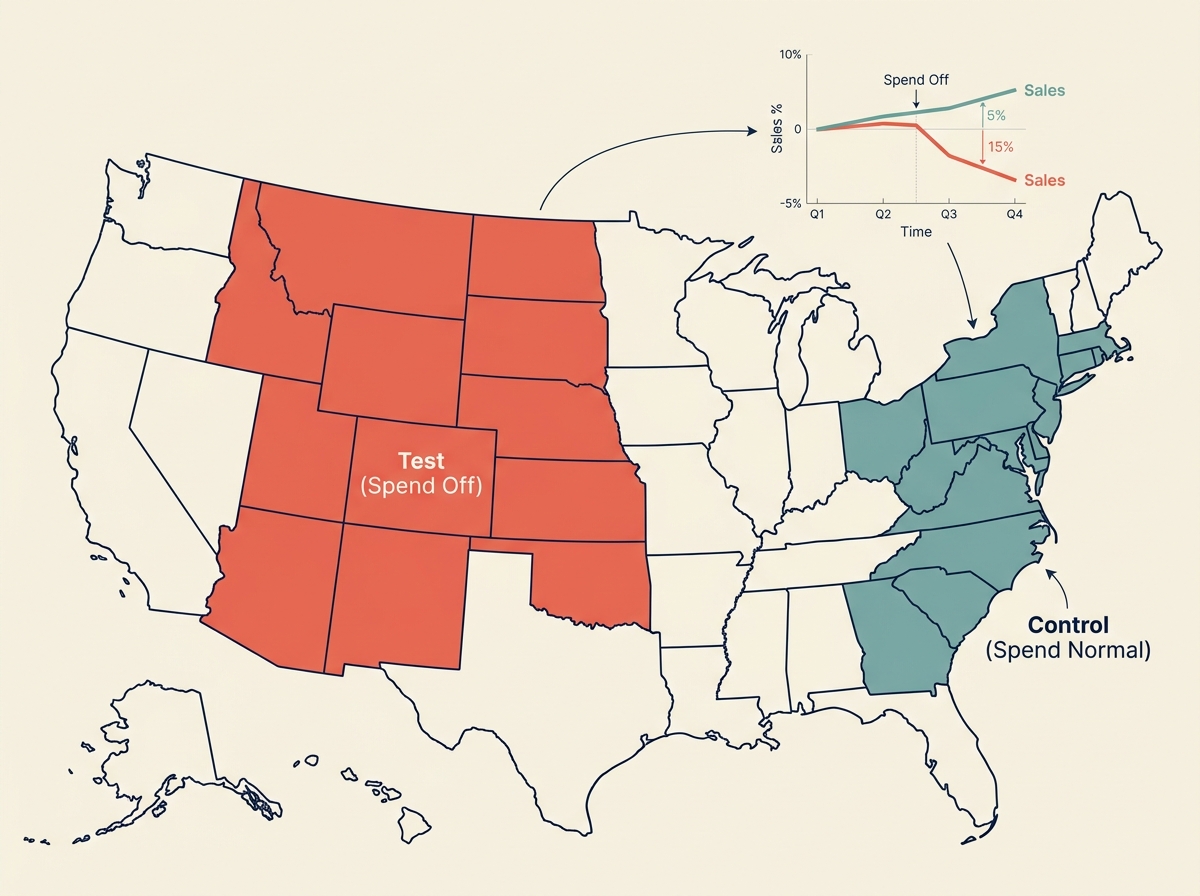
MMM is a top-down view, but it needs a ground-truth reality check. This is where incrementality testing comes in. The most effective method is a Geo-Test. You pick two similar regions (e.g., two cities with similar demographics), keep your spend normal in one, and completely turn off or double your spend in the other for 2 to 4 weeks.
Why it matters: This provides the 'lift' metric that proves your MMM is accurate. If the MMM says TikTok spend is driving a 2x return, a Geo-Test where you turn off TikTok should result in a corresponding drop in sales in that region. If sales don't drop, your MMM is over-attributing to TikTok, and you need to adjust your model's parameters.
Common pitfall: Choosing test regions that are 'contaminated.' If you run a national TV campaign at the same time as a local social media blackout test, the TV spend will muddy the results. Ensure no other major changes are happening during your test window.
Step 5: Iterative Optimization and Budget Reallocation
An MMM is not a one-and-done project. It is a living tool. You should update your model monthly or quarterly. As the market changes—for instance, as CPMs rise on Meta or new platforms like Threads gain traction—your contribution shares will shift.
You should use the 'Optimized Budget' output from your model to guide your next quarter's planning. If the model suggests that your Marginal Return on Ad Spend (mROAS) is still high on YouTube but flatlining on Instagram, it’s time to shift the weight of your spend.
Why it matters: This shifts the conversation with your CFO from 'We think this is working' to 'The model shows that every dollar shifted from Channel A to Channel B will yield a 12% increase in total revenue.' It provides the accountability that Search Engine Journal recently noted is often missing in AI-driven marketing environments [S5].
How to Verify Your Model is Working
You will know your MMM is successful when the 'Predicted Revenue' line on your chart closely tracks the 'Actual Revenue' line for a period of at least three months after the model was built. This is called 'out-of-sample' testing. If the model can accurately predict what happened last month based on the spend you put in, it is reliable enough to use for next month's budget allocation.
Furthermore, you should see a narrowing gap between your platform-reported ROAS and your model-reported ROAS. While they will never be identical, they should move in the same direction. If Meta says performance improved by 20% and your MMM says it improved by 18%, you have achieved a level of marketing measurement maturity that most brands lack.
Related Tactics to Explore Next
Once you have mastered the basics of MMM, consider these advanced strategies to further refine your social media measurement:
- Creative-Level Incrementality: Use 'Ghost Ads' or randomized control trials (RCTs) within platforms like Meta to see which specific creative angles drive the most lift, then feed those themes back into your broad MMM categories.
- Customer Lifetime Value (CLV) Integration: Instead of modeling against immediate revenue, model your spend against the predicted 12-month value of the customers acquired. This often justifies higher spends on platforms that have higher acquisition costs but better retention.
- Unified Measurement: Combine your MMM with a 'Post-Purchase Survey' (PPS). Ask every customer 'How did you hear about us?' and compare those proportions to your MMM contribution shares. Where they align, you have high confidence. Where they differ, you have a new area to investigate.
As the industry moves further away from the precision of the pixel, the brands that win will be those that embrace the 'probabilistic' nature of MMM. It’s time to stop looking for a 1:1 path and start looking at the total impact of your marketing ecosystem.
FAQ