If you are still relying on a platform-provided dashboard to justify your social spend, you aren't measuring; you're hallucinating. The era of the 'magic pixel' that perfectly stitched together a user's journey from a Reels view to a Shopify checkout is over. Between Apple’s App Tracking Transparency (ATT), the impending sunset of third-party cookies, and the rise of multi-device browsing, the data flowing into your Ads Manager is a fragmented, over-credited mess. To survive, mid-market brands must abandon the granular lie of last-click attribution and embrace the statistical rigor of Media Mix Modeling (MMM).
The fundamental lie of platform-based attribution
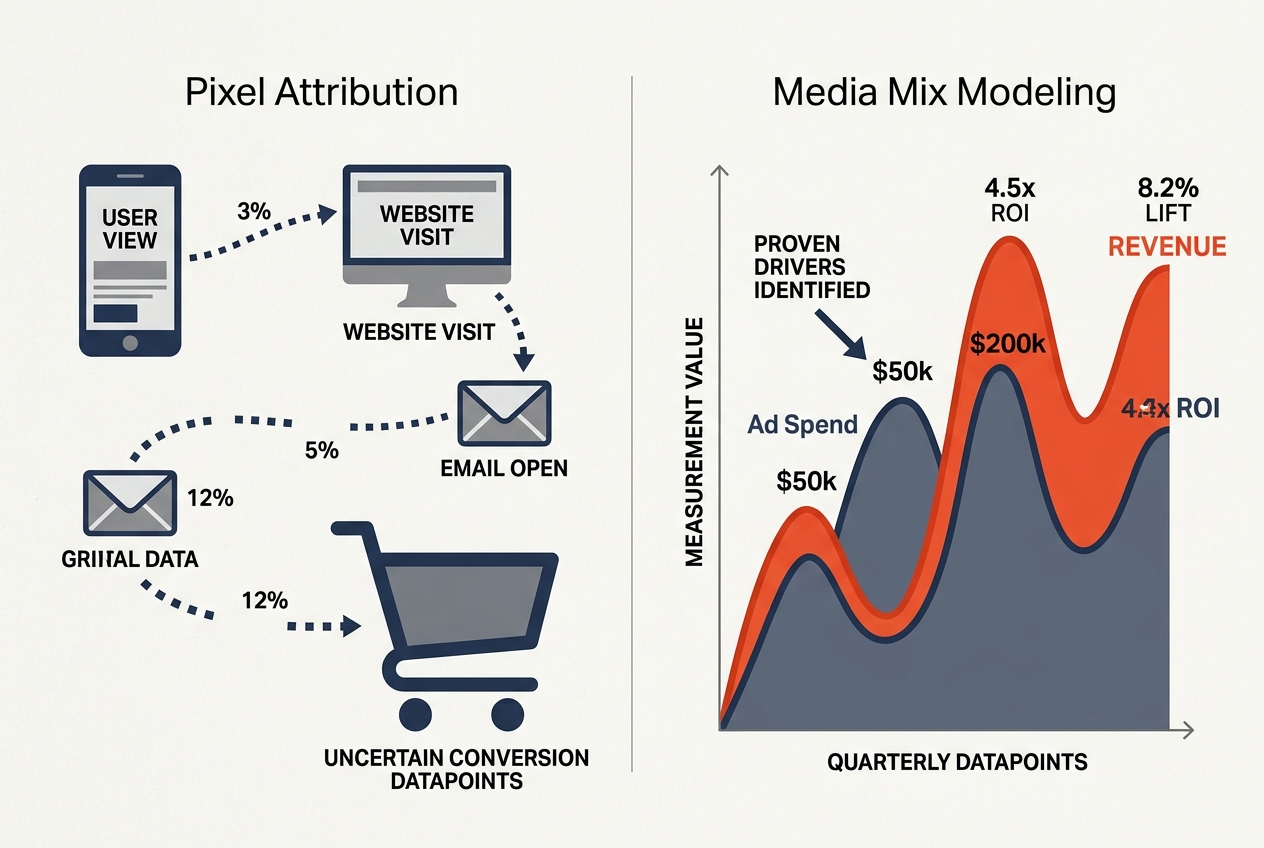
For a decade, we were spoiled. The Meta Pixel was so effective it felt like a utility. You put a dollar in, the dashboard showed you four dollars out, and everyone went to lunch. But that wasn't just tracking; it was a byproduct of a specific, temporary loophole in digital privacy that has now been closed. When Meta or TikTok claims a 4x Return on Ad Spend (ROAS) today, they are often grading their own homework using modeled data that leans heavily on 'view-through' conversions—events where a user saw an ad, didn't click, but eventually bought something anyway.
Did the ad cause the sale? Or was the user already going to buy, and the algorithm simply served an ad to a high-intent customer to claim the credit? This is the 'attribution tax.' According to internal benchmarks from several growth agencies following the iOS 14.5 fallout, platform-reported ROAS can overstate actual incremental revenue by as much as 30% to 50%. Conversely, for brands with long sales cycles, platforms often under-report value because they lose the trail after the 7-day click window.
We've reached a breaking point where the dashboard is no longer a source of truth; it’s a directional suggestion. If you want to know if your spend is actually growing the business, you have to look at the macro, not the micro. This is where MMM comes in. By analyzing the relationship between your total spends across channels and your total top-line revenue—while accounting for external factors like seasonality, promotions, and even economic shifts—MMM provides a cold, hard look at incrementality. It doesn't care about a single user's ID; it cares about the correlation between your $50,000 TikTok burst and the subsequent spike in baseline sales.
Why mid-market brands are ditching the 'Enterprise' stigma of MMM
Historically, Media Mix Modeling was the playground of the Fortune 500. It required six-figure consulting contracts with firms like Nielsen or Kantar and took six months to produce a report that was already out of date by the time it hit the CMO's desk. That friction kept mid-market brands—those spending between $50k and $500k a month on social—trapped in the pixel-tracking cycle.
However, the landscape has shifted. Open-source projects like Meta’s Robyn and Google’s LightweightMMM have democratized the math. Meanwhile, SaaS platforms like Recast, Measured, and Northbeam are offering 'MMM-lite' solutions that provide near real-time insights. You no longer need a PhD in statistics to run a regression analysis on your spend.
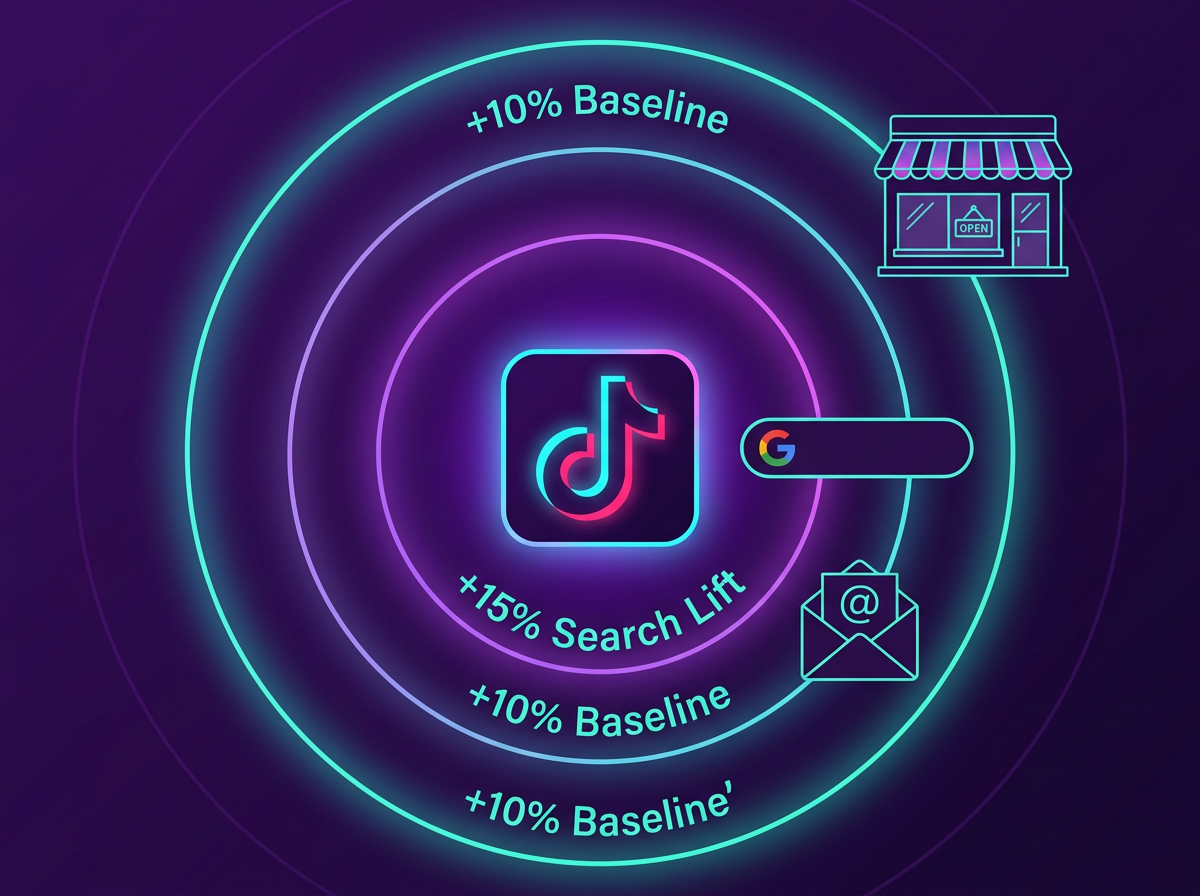
You've likely seen the shift in how platforms are positioning themselves. For instance, why TikTok ads are becoming a primary search engine highlights how the platform is moving away from pure entertainment toward utility. When users search on TikTok but buy on a desktop three days later, the pixel breaks. MMM captures that latent demand. Even Google is feeling the heat, recently expanding Gmail Ads into the bottom of Promotions and Social tabs [S3] to capture more touchpoints. When your ads are scattered across Gmail, Reels, and TikTok, trying to track a single 'path to purchase' is a fool's errand. MMM looks at the total weight of the spend rather than the individual footprints.
The counterargument: Is MMM too blunt for agile social teams?
The loudest critics of MMM argue that it lacks the granularity needed for daily optimization. If you're a social media manager trying to decide which specific Reel creative to put another $500 behind, a macro-model that updates weekly or monthly feels useless. They argue that 'in-platform' signals—like click-through rates (CTR) and thumb-stop rates—are the only way to move fast.
This is a fair point, but it misses the forest for the trees. Granular metrics are excellent for creative testing, but they are disastrous for budget allocation. Just because Ad A has a higher CTR than Ad B doesn't mean Ad A is driving more incremental profit. It might just be reaching 'cheaper' users who click on everything but never buy.
To bridge this gap, modern strategists are using a 'Triangulation' method. They use platform metrics for creative creative-level winners, MMM for channel-level budget setting, and occasional Incrementality Tests (Lift Tests) to validate the model. For example, a brand might turn off all Meta spend in a specific geographic region for two weeks to see the actual impact on total revenue. If revenue drops by exactly the amount Meta claimed it was generating, the pixel is right. If revenue only drops by half that amount, you know your 'true' ROAS is half of what the dashboard says.
Proving social value in the age of AI-generated answers
The measurement challenge is getting even weirder with the rise of AI. As Google integrates AI Overviews and Search Generative Experience (SGE), the line between a brand mention and a paid placement is blurring. Recent reports on Google’s June spam updates [S5] show that the search giant is struggling to police the boundary between earned mentions and engineered AI influence.
If a user asks an AI 'What is the best sustainable skincare brand?' and the AI mentions your brand because of your heavy presence on social media, how do you attribute that? A pixel can't track a 'mention' in a Large Language Model's weights. But if your MMM shows that every time you increase spend on high-reach creator partnerships, your 'unbranded' search volume and AI-mention frequency increase, you have a data-backed story to tell your CFO.
This is the 'halo effect' that social media managers have talked about for years but could never prove. With a proper model, you can finally show that your TikTok spend isn't just driving 'TikTok sales'—it's lowering your blended Customer Acquisition Cost (CAC) across the entire business by fueling the top of the funnel.
How to start your MMM journey tomorrow
You don't need a $100,000 budget to start. You need your data in order. The biggest hurdle to modeling isn't the math; it's the hygiene. Most mid-market brands have their spend data siloed in five different dashboards and their revenue data buried in an ERP or Shopify backend.
Step 1: Centralize your data. Use a tool like Supermetrics or Fivetran to pull all your daily spend by channel into a single Google BigQuery or Snowflake instance. You need at least two years of historical data to account for seasonality.
Step 2: Define your external variables. Your model needs to know when you ran a 20% off sale, when a competitor launched a major campaign, and even when major holidays occurred. Without this, the model might mistake a Black Friday spike for 'great Facebook ad performance.'
Step 3: Choose your tool. If you have a data scientist on staff, point them toward Meta’s Robyn. If you don't, look at a 'plug-and-play' MMM provider. These tools are becoming the new standard for brands that have outgrown the 'spend and pray' method.
building a social media content plan that feeds the model is your next step. You need a consistent volume of content to generate the data points a model needs to find patterns. A erratic posting schedule makes for a noisy, unreliable model.
The Falsifiable Prediction
Here is my stake in the ground: By the end of 2026, 'Last-Click ROAS' will no longer be a KPI used in any professional marketing agency's reporting for clients spending over $1M annually. It will be replaced entirely by Contribution Margin and MMM-derived Incrementality. The brands that fail to build these models now will find themselves unable to scale, as they will be optimizing for platform-reported 'phantom' conversions while their actual bank balances stagnate. The pixel is dead. Long live the model.
FAQ