


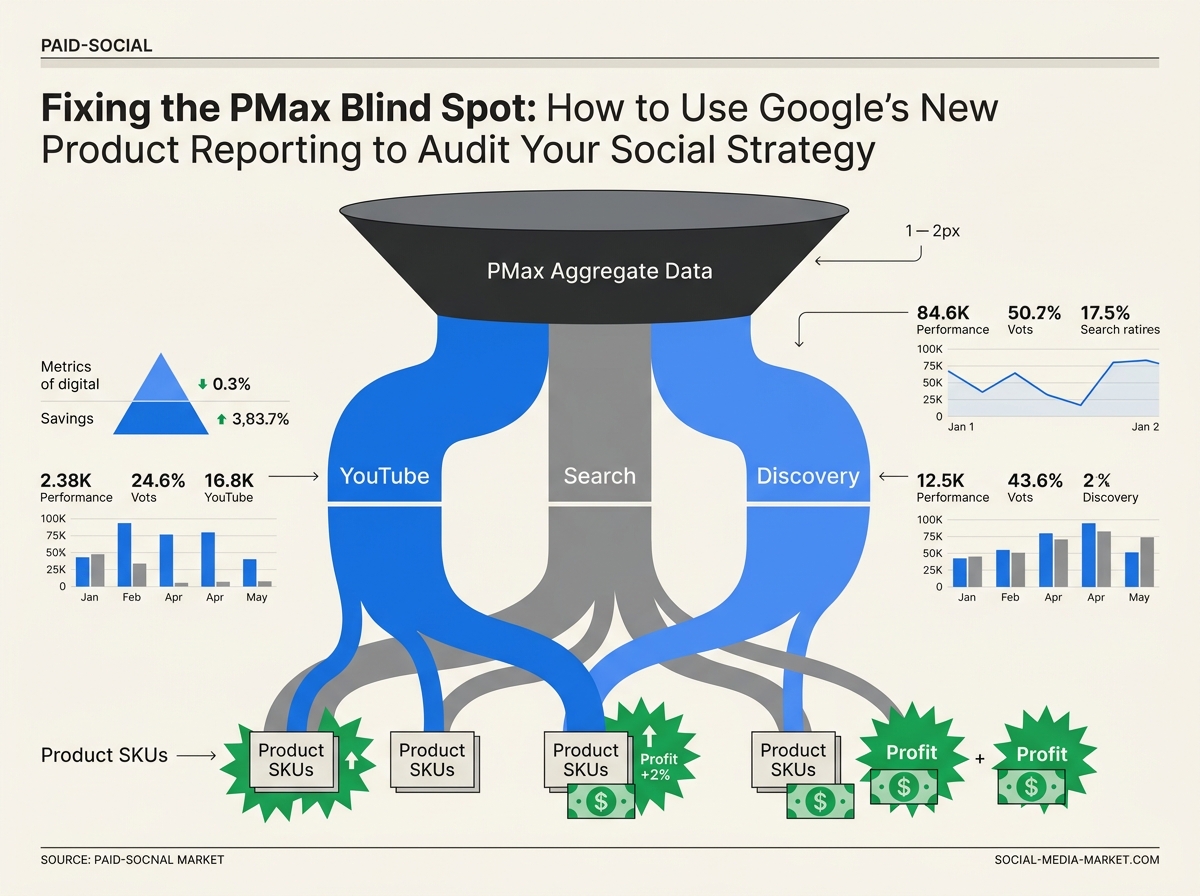
Performance Max has long been the 'black box' of the Google ecosystem. For years, social media managers and paid-search buyers have operated in silos, often bidding against each other for the same customer attention without knowing which creative assets or products were doing the heavy lifting on YouTube versus the Search SERP. That changed this week. Google has finally expanded granular product-level reporting across the entire PMax network, including YouTube, Discovery (now Demand Gen), and Gmail.
Why it matters: You can now see exactly which products are converting on video-first surfaces. This isn't just a Google update; it’s a direct window into your social-commerce performance. If a specific SKU is crushing it on YouTube but failing in Search, your creative strategy needs to pivot. You have a narrow window to capture this baseline data before the algorithm adjusts and the competitive landscape shifts.
Key takeaways
- Granularity is here: You can now view ROAS and conversion value at the SKU level specifically for YouTube and Discovery placements within PMax.
- Inventory Audit: Use this data to identify 'social-first' products that deserve dedicated budget in TikTok or Meta campaigns.
- Asset Mapping: High-performing products on YouTube often lack the necessary video assets; this reporting tells you exactly where to invest in production.
The shift from aggregate to granular placement data
Until now, PMax reporting was largely a guessing game. You knew the campaign worked, but you didn't know if it worked because of a high-intent search query or a serendipitous discovery on a YouTube pre-roll. By opening up product reporting across all networks, Google is effectively providing a retail media network level of detail within its most automated campaign type.
This update arrives at a precarious time for Google. With reports from Bloomberg via Search Engine Journal [S5] indicating delays in Gemini 3.5 Pro due to coding hurdles, the platform is leaning heavily on its existing ad infrastructure to maintain dominance. For you, this means the 'AI' isn't getting smarter as fast as Google promised, but the reporting is finally catching up to what practitioners need.
When you log into the Report Editor today, you'll see a spike in metrics. This isn't necessarily a surge in sales; it's the system finally attributing existing sales to the correct sub-network. Don't mistake this for a sudden performance boost. It’s a clarity boost. You are seeing the 'ghost' conversions that were previously hidden in the 'Other' or 'Cross-network' buckets.
How to audit your YouTube vs. Search product performance
To make sense of this new data, you need to build a custom report that segments by 'Placement' and 'Product ID'. This is where the social crossover becomes apparent.
Step 1: The Placement Breakdown
Navigate to the 'Reports' tab and select 'Custom'. Add 'Campaign', 'Product ID', and 'Network (with search partners)' as your rows. For your columns, focus on 'Conv. value / cost' (ROAS) and 'Impr. (Abs. Top %)'.
What you're looking for are products that have a high ROAS on the YouTube Network but a low ROAS on Search. These are your 'Visual Winners'. These products are likely being sold through impulse or brand affinity rather than direct-answer search queries. If you see a product with a 4.0 ROAS on YouTube and a 1.2 on Search, that product is being mismanaged if it's only getting 'Search-style' static assets.
Step 2: Correlating with TikTok and Meta
This is where the 'Social Cross-Over' happens. Compare your top 10 YouTube-performing SKUs from PMax with your top-performing creative on Meta. Often, you'll find a mismatch. If SKU-A is a star on YouTube but you aren't running it on TikTok, you're leaving money on the table. Conversely, if a product is a hero on Meta but Google's new reporting shows it's a dud on YouTube, the issue is likely the creative format, not the product itself.
Identifying the 'Social-First' product catalog
Not every product in your Merchant Center is meant for social discovery. Some items are 'utility' buys—people search for them when they need them. Others are 'aspiration' buys—people buy them when they see them in a beautiful video.
The Utility Profile:
- High Search ROAS
- Low YouTube View-through rate
- Low 'Engaged-view' conversions
- Strategy: Keep these in PMax but prioritize high-quality text assets and structured data.
The Aspiration Profile:
- High YouTube/Discovery ROAS
- High 'Engaged-view' conversion value
- Frequent 'New Customer' acquisition
- Strategy: Pull these into a dedicated 'Demand Gen' campaign or increase their weight in your TikTok Shop strategy.
Recent moves in the industry suggest this convergence is accelerating. For instance, Vendasta being badged as a TikTok Channel Sales Partner [S2] highlights how even local advertisers are being pushed toward short-form video. If you aren't using your PMax data to inform your TikTok spend, you are operating with one eye closed.
Troubleshooting the 'Spike' in reported metrics
When you first enable the new reporting views, your dashboard might look like it's hallucinating. You might see a 20% jump in attributed revenue for certain products. This is the 'One-Time Opportunity' mentioned in the title. This spike is caused by the reclamation of 'Unattributed' conversions.
If your metrics look too good to be true, check your attribution model. Google defaults to Data-Driven Attribution (DDA), which can be generous to its own networks. Cross-reference this with your Shopify or GA4 'First Click' data. If PMax is claiming a sale on YouTube that GA4 says started with a TikTok click, you've found your attribution overlap.
Don't 'fix' this by cutting spend. Use it to justify a higher blended ROAS target. You now have the proof that your 'Search' budget is actually acting as 'Social' budget. This is powerful leverage when talking to CFOs who only want to fund 'bottom-of-funnel' activities.
Advanced Workflow: The PMax-to-Social Creative Bridge
Once you’ve identified your top 5 'Visual Winners' from the new PMax reports, follow this workflow to maximize the cross-channel impact:
- Extract the 'Winning' Frames: Use a tool like Vidyard or even manual scrubbing to see which part of your YouTube video asset correlates with the conversion spike.
- Repurpose for Spontaneity: As noted at the Adweek Sports Marketing Summit [S3], the future belongs to brands that can respond to cultural moments. Take your PMax winners and put them into a 'reactive' creative shell—trending audio or a current event overlay.
- Test as 'Demand Gen' Only: Take these specific SKUs out of the general PMax bucket for two weeks. Run them in a Demand Gen campaign (formerly Discovery) with a focus on YouTube Shorts. If the ROAS holds, you've successfully graduated a product from 'Search' dependency to 'Social' scale.

The Netflix Factor: Why Video Reporting is the New Gold Standard
As Netflix moves toward closing major ad deals and shifts its viewership reporting [S4], the entire digital landscape is moving toward a 'black box' model of premium video. Google’s decision to offer more transparency in PMax is a strategic counter-move. They want you to see the value of YouTube because they know that soon, you'll be comparing those CPMs to Netflix and Disney+.
By mastering this reporting now, you are training yourself to evaluate video ads not just as 'awareness' but as direct-response drivers. When your boss asks why you're spending $50k on YouTube Shorts instead of Search, you won't point to 'impressions.' You'll point to the SKU-level conversion value that was previously hidden in the PMax void.
How to apply this tomorrow
You don't need a massive agency to do this. If you're a social media manager, ask your PPC lead for a 'Product x Network' export from the Google Ads Report Editor.
Look for the 'Zombies'—products that have zero spend on Search but are eating up budget on YouTube. If they aren't converting, exclude them from the PMax campaign entirely. Those 'Zombies' are often the reason your overall PMax ROAS feels stagnant. By pruning the products that don't translate to video, you free up the AI to spend on the products that actually move the needle on social surfaces.
This is a temporary window. As more advertisers adopt these reporting views, the cost-per-click on high-performing 'Visual Winners' will rise. The arbitrage opportunity is happening right now. Fix your crossover, align your creative, and stop letting the black box dictate your product strategy.

Future-Proofing Your Social-Search Strategy
In the coming months, expect Google to integrate more 'Social' signals into these reports. We are already seeing the influence of platforms like Reddit on AI search citations [S1]. It is not a stretch to imagine a future where your PMax report includes a 'Social Sentiment' or 'Reddit Mention' column that correlates with your YouTube conversion lift.
For now, focus on the data you have. The silos are breaking down. Whether you're an agency strategist or a brand lead, the ability to read a PMax report like a social media dashboard is the most valuable skill you can develop in 2026. Stop treating Google as a search engine and start treating it as the largest social-commerce engine in your arsenal.
Your competitors are still looking at 'Total Campaign Performance.' You should be looking at the SKU that just went viral on YouTube and making sure it has a 20% higher bid on TikTok by lunch. That is how you win the cross-channel game.
FAQ