

If you are still walking into quarterly business reviews with a deck full of impressions and click-through rates, you aren't just losing the room—you're losing your budget. In a post-cookie landscape where privacy-first browsing and dark social have rendered traditional last-click attribution obsolete, the CFO no longer cares about how many people 'saw' your LinkedIn ad. They care about how that ad shortened the sales cycle for a six-figure contract.
While consumer brands like Skyscanner are finding success bridging the gap between digital and physical—as seen in their recent TikTok-to-terminal OOH campaigns [S2]—B2B teams face a higher bar for proof. We are moving away from the era of 'lead volume' as a primary KPI. Why? Because a thousand low-intent whitepaper downloads that never convert to a discovery call are a drain on sales resources, not a win for marketing. As in-house agencies become more strategic [S4], the focus is shifting toward deep integration with the CRM and the finance department’s ledger.
TL;DR
- Stop prioritizing volume: High lead counts often mask poor lead quality and high CAC.
- Focus on Velocity: Social's real value lies in accelerating the movement of target accounts through the funnel.
- Measure Influence, Not Just Source: Use 'Self-Reported Attribution' to capture the 80% of the journey happening in dark social.
- Connect to the Win-Rate: Prove that social-touched deals close at a higher percentage than cold-outbound deals.
Why the Lead Volume Era Ended
For a decade, the B2B social playbook was simple: run a lead-gen form on LinkedIn, trade a PDF for an email address, and hand the 'lead' to an SDR. But the efficiency of this model has cratered. Per recent industry benchmarks from agencies like Metadata, the average cost-per-lead (CPL) for B2B tech has climbed 25% year-over-year, while lead-to-opportunity conversion rates have plummeted.
The problem is 'Information Gain.' As Google’s recent patent updates suggest [S1], the internet is flooded with derivative content. If your social strategy is just distributing the same generic insights as your competitors to capture an email, you aren't building a relationship; you're creating noise. To survive, B2B social teams must adopt metrics that reflect the complexity of the modern buyer's journey—a journey that often involves 6 to 10 stakeholders and spans six months or more.
How to master LinkedIn's new Thought Leader Ads
1. Social-Influenced Pipeline Velocity
The metric: The average time it takes for an account to move from 'Marketing Qualified Lead' (MQL) to 'Closed Won,' specifically comparing accounts that engaged with social content versus those that did not.
Pipeline velocity is the ultimate antidote to the 'social is just top-of-funnel' argument. When you measure velocity, you are looking at how social media acts as a lubricant for the sales machine. If an account is regularly consuming your senior leadership's insights on LinkedIn or watching your product deep-dives on YouTube, they arrive at the sales meeting with higher intent and fewer basic questions.
According to data from Gong, deals where the buyer has engaged with the seller’s brand on social prior to the first call close significantly faster. To track this, you need a tight integration between your social management platform—like Sprout Social or Sprinklr—and your CRM (Salesforce or HubSpot). You aren't looking for who clicked an ad; you're looking for which accounts in your 'Target Account List' had multiple stakeholders engaging with your organic and paid posts. If 'Social-Touched' accounts close in 45 days while others take 60, you've just found your most powerful ROI lever.
Best for: Teams with a high-touch sales model and long (3+ month) sales cycles.
2. The 'Self-Reported Attribution' Delta
The metric: The percentage of closed-won revenue that buyers explicitly attribute to social media in 'How did you hear about us?' free-text fields, compared to what software attribution claims.
Software-based attribution (like Google Analytics 4 or Bizible) is notoriously bad at tracking B2B social. It misses the podcast listener, the person who saw a post on their phone and later searched on their desktop, and the peer recommendation in a private Slack community. This is 'Dark Social.' To surface this value to the CFO, you must implement a mandatory, non-dropdown 'How did you hear about us?' field on your high-intent forms (demo requests, contact sales).
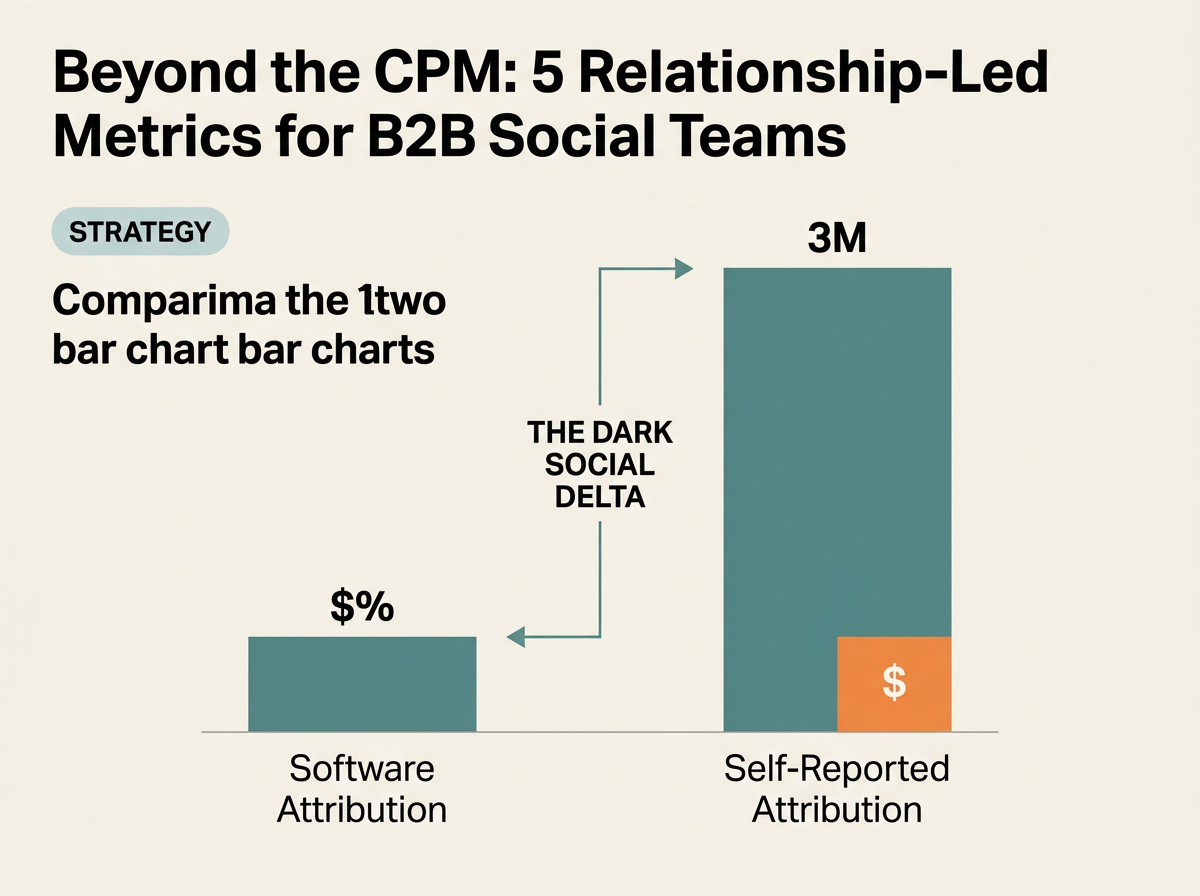
The 'Delta' is the gap between the two. If GA4 says social contributed $100k in revenue, but your self-reported field shows $500k, that $400k difference is your 'Dark Social' value. This metric proves that social is a primary discovery channel even when the 'last click' says otherwise. It changes the conversation from 'Why is our social CPL so high?' to 'Why are our best customers all saying they found us on LinkedIn?'
Best for: Brands heavily invested in organic social, executive thought leadership, and community building.
3. Account-Based Engagement (ABE) Depth
The metric: The number of unique stakeholders within a target account who have engaged with your social content over a 90-day period.
In B2B, you don't sell to a person; you sell to a committee. Traditional social metrics focus on the individual ('Who clicked?'). Relationship-led metrics focus on the account. If you are targeting a Fortune 500 company, one click from a junior manager doesn't mean much. But if the VP of Finance, the Director of IT, and the CMO are all liking, sharing, or commenting on your content, the account is 'warmed up.'
Tools like LinkedIn's Account Insights or specialized ABM platforms like 6sense allow you to see this aggregate engagement. Reporting on ABE depth allows you to tell the CFO: 'We haven't just reached 10,000 people; we have reached 80% of the buying committee at our top 50 target accounts.' This is a qualitative shift in how we define 'reach.' It’s about density within the accounts that actually move the needle for company revenue.
Building a B2B influencer program that actually converts
4. Social-Driven Win-Rate Lift
The metric: The percentage difference in win rates between deals that had social media touchpoints and those that were purely outbound or search-driven.
This is the metric that gets you a seat at the table during budget season. It requires a 'control' and an 'exposed' group. By tagging every opportunity in your CRM that originated from or was influenced by a social campaign, you can run a simple comparison. If your company's average win rate is 20%, but for 'Social-Influenced' deals it is 28%, you have a 40% lift in win-rate.
CFOs love this because it speaks to efficiency. Increasing the win rate is often more cost-effective than doubling the lead volume. It suggests that social is doing the heavy lifting of building trust and authority before the salesperson even picks up the phone. As Amazon Ads' recent growth in the Upfronts suggests [S5], even the biggest players are doubling down on environments where they can prove direct correlation to business outcomes rather than just 'eyeballs.'
Best for: Marketing teams that are tightly aligned with Sales Operations and have clean CRM data.
5. Share of Voice (SOV) in 'Category Entry Points'
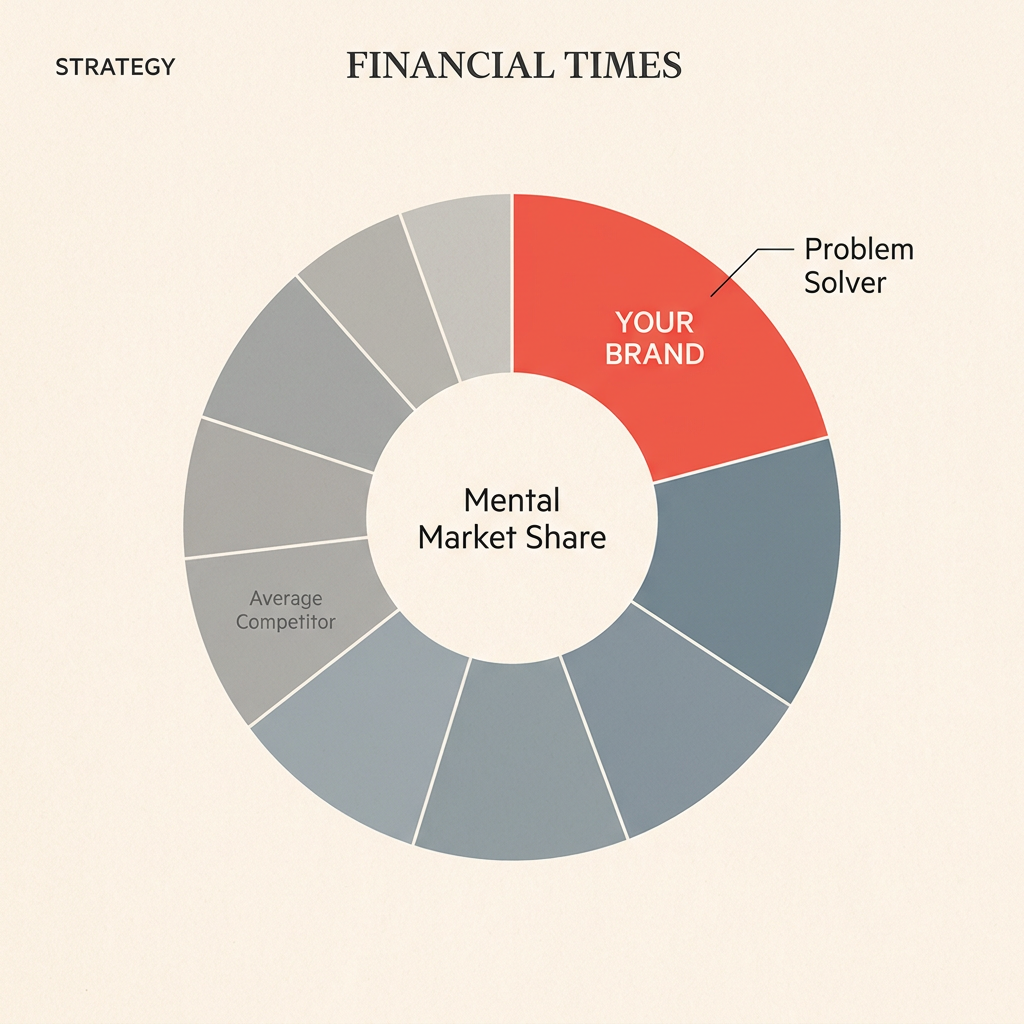
The metric: The frequency with which your brand is mentioned or appears alongside specific 'Category Entry Points' (CEPs) compared to your top three competitors.
B2B buying often happens when a specific problem arises—a 'Category Entry Point.' For example, for a cybersecurity firm, a CEP might be 'preparing for a SOC2 audit.' Relationship-led social teams don't just track their brand name; they track how often they are the 'mental shortcut' for that problem.
Using social listening tools like Brandwatch or Talkwalker, you can measure your SOV not just against your competitors' names, but against the problems you solve. If your brand is mentioned in 40% of social conversations regarding 'SOC2 compliance' while your competitor is only in 10%, you have a dominant mental market share. This is a leading indicator of future pipeline. Before someone searches for a solution on Google, they have a 'shortlist' in their head. Social media's job is to put you at the top of that shortlist.
Best for: Category leaders or challengers looking to disrupt an established market.
How to Present This to the CFO
When you present these metrics, context is everything. Don't lead with the 'what'; lead with the 'so what.' Instead of saying 'Our pipeline velocity improved,' say 'By leveraging social content to educate buyers earlier, we reduced the sales cycle by 12 days, which effectively adds $2M to our annual capacity without hiring more sales reps.'
This shift requires a change in the social team's daily workflow. You are no longer just 'content creators'; you are revenue researchers. You need to spend as much time in Salesforce as you do in the LinkedIn Campaign Manager. You need to understand the 'Average Contract Value' (ACV) and the 'Customer Acquisition Cost' (CAC) of every channel.
As TikTok marketing strategies evolve to drive 'real business results' [S3], the platforms themselves are providing more granular data. But the data alone isn't the story. The story is how social media builds the trust necessary to facilitate a high-stakes B2B transaction. In the next 18 months, the teams that thrive will be those that stop treating social as a 'top-of-funnel' megaphone and start treating it as a 'mid-to-bottom-funnel' accelerator.
The Roadmap for Implementation
Transitioning to these metrics won't happen overnight. It requires a three-step rollout:
- The Audit Phase (Month 1): Add 'Self-Reported Attribution' to your forms. Begin tagging all social-driven traffic with UTM parameters that sync to your CRM's 'Lead Source' and 'Latest Touch' fields.
- The Benchmark Phase (Month 2-3): Collect enough data to establish your baseline win rates and pipeline velocity for non-social deals. This is your 'control' group.
- The Reporting Phase (Month 4+): Monthly reports should now lead with Pipeline Velocity and Win-Rate Lift. CPM and CTR should be relegated to the appendix as 'diagnostic metrics'—useful for the social team to optimize creative, but not for the executive team to judge success.
By focusing on these relationship-led metrics, you move social from a 'discretionary spend'—the first thing cut in a recession—to a 'strategic asset' that the CFO views as essential for predictable revenue growth. The era of vanity is over; the era of the 'Revenue-Driven Social Team' has arrived.
FAQ