By the end of this guide, you will have a functional roadmap for transitioning your social media reporting from engagement-based 'vanity' metrics to revenue-driving incrementality frameworks. You'll move away from the trap of last-click attribution—which consistently undervalues social discovery—and toward a model that your CFO actually trusts. Before starting, ensure you have access to your platform-level conversion APIs (CAPI), historical spend data by channel for the last 24 months, and a clean view of your direct-to-consumer or CRM-based revenue.
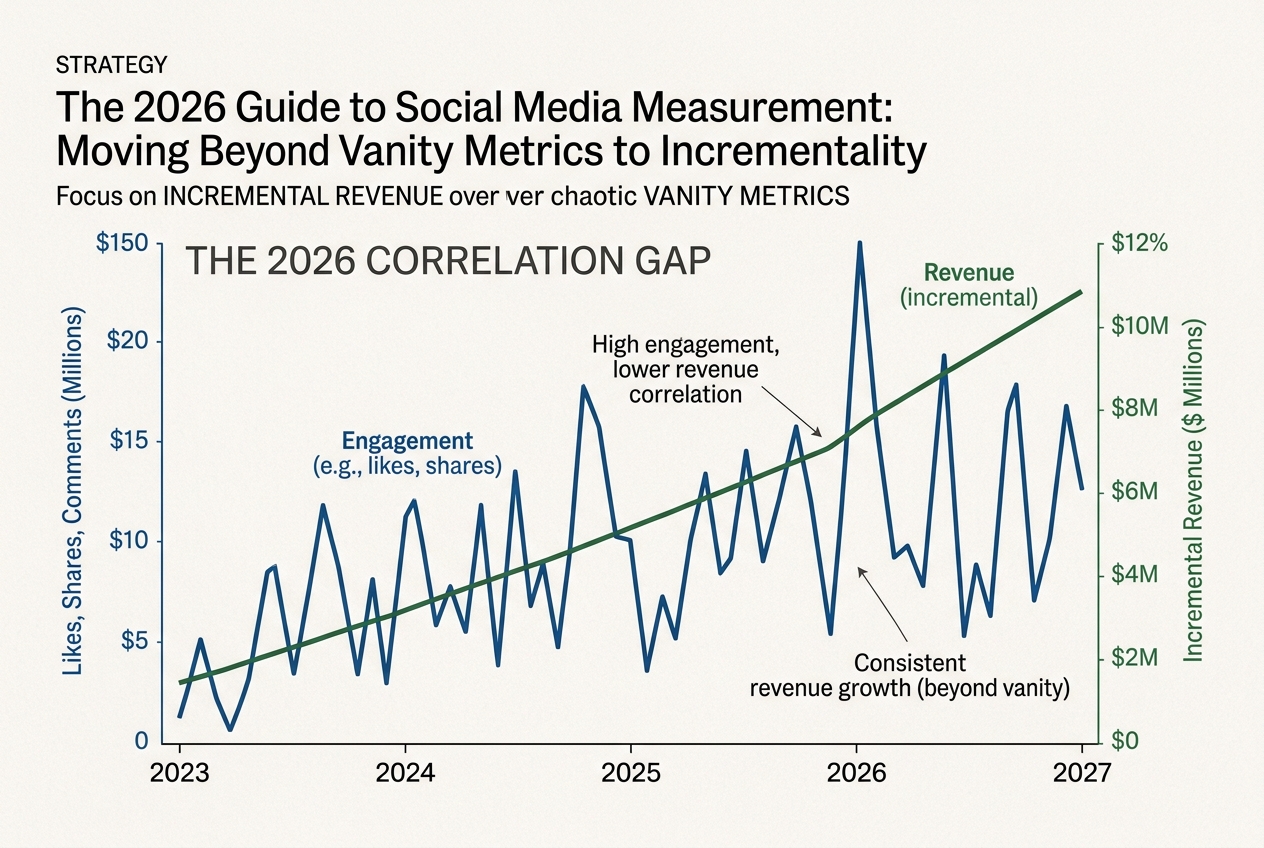
For years, social media managers have lived in a comfortable delusion. We tracked likes, comments, and shares, assuming they were leading indicators of sales. But as of mid-2026, that correlation has effectively snapped. Per recent analysis from The National Law Review regarding the Indian market—a bellwether for global social trends—social marketing is increasingly 'broken' because high engagement no longer translates to revenue in a linear fashion. The reason? Algorithm shifts, like Instagram's late-2025 Reels update, have prioritized mass reach over community-driven conversion, flooding feeds with content that users enjoy but never buy from.
Step 1: Audit your existing 'Signal-to-Noise' ratio
Before you can build a new measurement framework, you must dismantle the old one. Most brands are currently over-reporting on 'noise' metrics. To start, you need to map every metric you currently track against its actual correlation with your primary business outcome (usually revenue or lead quality).
What to do: Take your last 12 months of social data. Run a simple Pearson correlation coefficient test between your weekly 'Total Engagements' and 'Total Revenue.' In many modern accounts, this number is now hovering below 0.3—meaning there is almost no relationship between the two. You are looking for 'High Signal' metrics. These are usually deeper down the funnel: saves, shares to DMs (not public shares), and website visits that stay on-page for more than 60 seconds.
Why it matters: If you don't prove to your stakeholders that likes are decoupled from dollars, they will continue to demand content that 'goes viral' but fails to move the needle. You need this data to justify the shift toward more complex testing like incrementality.
Common pitfall: Don't ignore 'Saves.' While likes have lost their luster, saves remain a high-intent signal in 2026. Users save what they intend to buy or revisit. Our internal benchmarks show that saves have a 4x higher correlation with conversion than likes on Instagram and TikTok.
Step 2: Establish a baseline with Geo-Lift testing
Incrementality is the measure of the lift that helps you understand the true impact of your ads. It answers the question: 'Would this sale have happened if the user hadn't seen the social ad?' The cleanest way to measure this without relying on cookies or flawed tracking pixels is Geo-Lift testing.
What to do: Identify two geographically distinct regions with similar historical sales profiles—for example, two similar mid-sized states or cities. Continue your 'business as usual' (BAU) social spend in Region A (the control) and completely turn off or significantly increase spend in Region B (the test) for a period of 4 to 6 weeks.
You aren't looking at platform reporting here; you are looking at your total bottom-line revenue in those specific regions. The difference in revenue growth between the two regions, adjusted for historical variance, is your 'incremental lift.'
Why it matters: This bypasses the entire 'attribution' mess. It doesn't matter if the user clicked an ad, saw a Reel, or heard about you from a friend—if the only difference between the two regions was your social spend, the revenue delta is your social ROI. This is the gold standard for social media incrementality measurement in a post-cookie world.
Common pitfall: Seasonal interference. Don't run a Geo-Lift test during Black Friday or a major regional holiday. The 'noise' from external market factors will drown out your test signals.
Step 3: Integrate Social into a Media Mix Model (MMM)
Media Mix Modeling (MMM) used to be the playground of Fortune 500 brands with seven-figure analytics budgets. In 2026, open-source tools like Meta's Robyn or Google's LightweightMMM have democratized this for the mid-market. MMM uses statistical techniques to determine how much each marketing channel contributes to the bottom line.
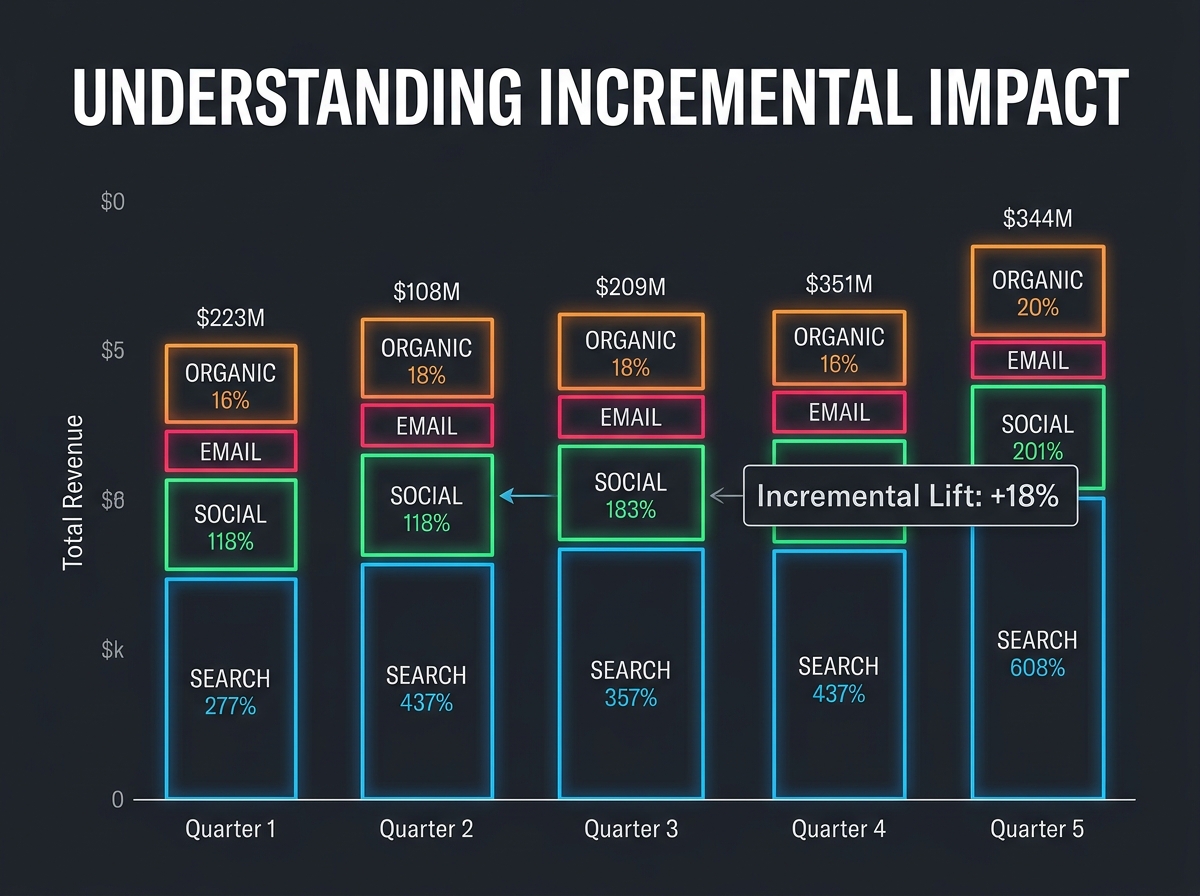
What to do: Consolidate your weekly spend data across all channels (Social, Search, OOH, TV, Email) and your weekly revenue data for the past two years. Feed this into an MMM tool. The model will calculate a 'coefficient' for social media. This coefficient tells you exactly how much revenue is generated for every dollar spent on social, accounting for the 'halo effect' that social has on other channels like Organic Search.
Why it matters: Social media is often the 'assist' in a conversion journey. A user sees a TikTok, then later searches for the brand on Google. Last-click attribution gives all the credit to Google. MMM recognizes the TikTok view as the catalyst. This is essential for defending social budgets when the direct-response numbers look soft.
Common pitfall: Data sparsity. MMM requires a lot of data. If you only have three months of spend history, the model will be wildly inaccurate. Aim for at least 104 weeks (two years) of data to account for seasonality.
Step 4: Implement TikTok's 'High Impact' and AI-driven signals
As announced at TikTok World ‘26, the platform is moving toward 'Vertical Experiences' that use AI to predict business growth rather than just video views. You need to align your measurement with how the platforms themselves are now optimizing for commerce.
What to do: Shift your ad optimization away from 'Traffic' or 'Reach' and exclusively toward 'Value' or 'Conversion' using TikTok's advanced signal tools. Use their new 'Impact Solutions' which integrate directly with your CRM to feed offline conversion data back into the algorithm. This creates a feedback loop where the AI finds users who don't just watch, but have a high probability of high-ticket purchase.
Why it matters: When the platform's AI knows what a 'sale' looks like (not just a 'click'), it stops wasting your budget on 'professional likers'—users who engage with everything but never buy. This significantly improves your incrementality scores.
Common pitfall: Setting the conversion window too short. With high-consideration products (like real estate, as noted in The Guardian Nigeria), the social-to-sale journey can be 90 days. A 7-day attribution window will make your social spend look like a failure.
Step 5: Verification — The 'Triangulation' Method
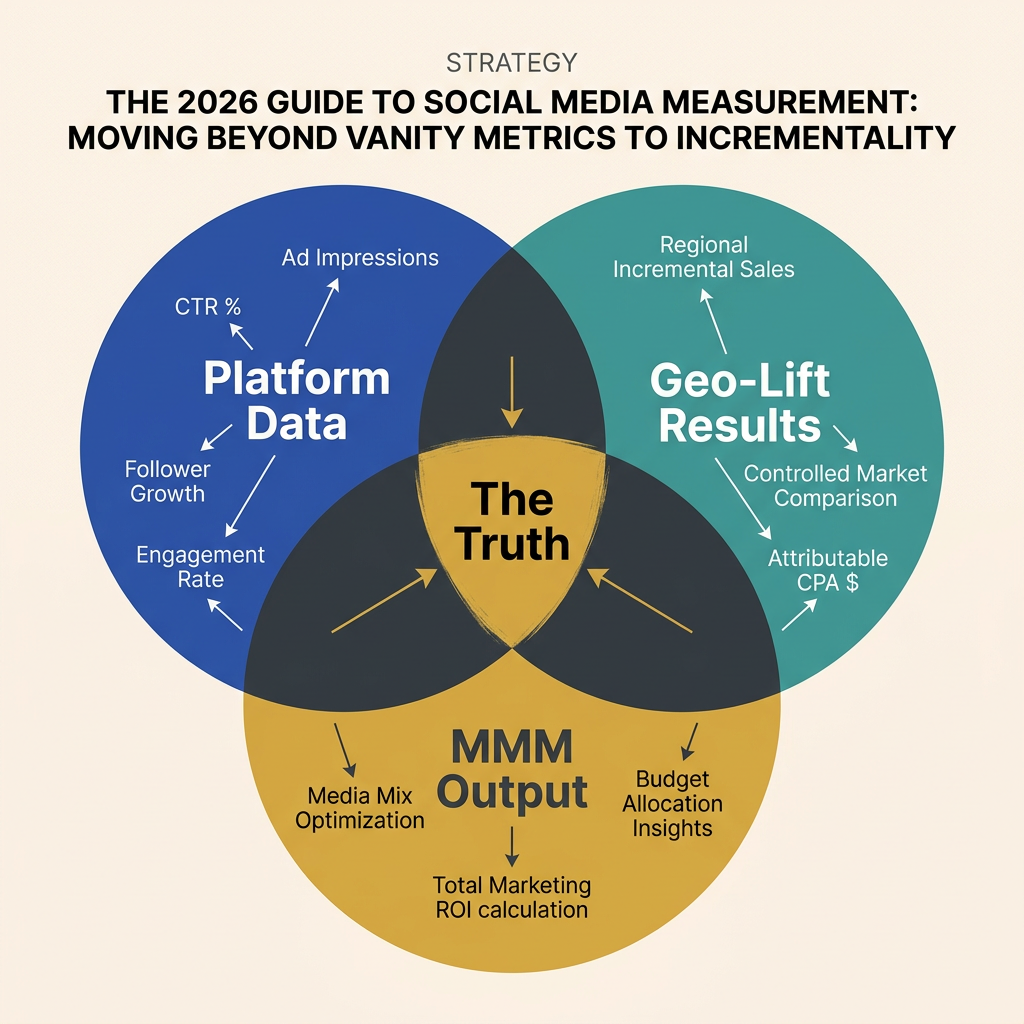
How do you know if your new measurement framework is working? You use the Triangulation Method. No single source of truth exists in 2026 marketing; instead, you look for where three different data sources overlap.
What to do: Compare the ROI figures from three distinct sources:
- Your Platform Reporting (the most optimistic view).
- Your Geo-Lift Test results (the most realistic view).
- Your MMM Output (the most holistic view).
If all three methods suggest your social ROI is between 3.5x and 4.2x, you have achieved 'measurement convergence.' You can now report this number to leadership with high confidence. If there is a massive discrepancy—for example, Meta claims a 10x ROI while your MMM shows 1.2x—you know your platform tracking is over-counting and you need to adjust your vanity metrics vs ROI strategy.
Why it matters: Verification prevents you from making massive budget mistakes based on a single flawed data point. It builds long-term credibility with the finance department.
Common pitfall: Confirmation bias. Don't just pick the highest number of the three because it makes your department look better. The goal is accuracy, not ego.
Three Related Tactics to Try Next
Once you have mastered the basics of incrementality and MMM, you can further refine your social performance with these advanced tactics:
- Post-Purchase Surveys (PPS): Add a simple 'How did you hear about us?' question to your checkout page. While subjective, this 'zero-party' data often reveals social influence that even the most advanced MMM might miss, especially for 'dark social' shares in apps like WhatsApp or Telegram.
- Creator-Specific Incrementality: Don't just measure your brand's spend. Run Geo-Lift tests on specific high-tier creator partnerships. Turn a creator's Spark Ads on in one region and off in another to see if their 'influence' actually moves product or just generates comments.
- Predictive LTV Modeling: Use your social signals (like 'Save' rates and 'Profile Visits') to predict the Lifetime Value of customers acquired through social. Our data suggests that customers who engage with educational social content before buying have a 20% higher LTV than those who buy from a transactional 'Flash Sale' ad.
Transitioning to these frameworks isn't a weekend project—it’s a fundamental shift in how your organization views social media. But as the gap between 'virality' and 'value' continues to widen, it is the only way to ensure your social strategy survives the 2026 fiscal year.
FAQ