Reactive customer care is a relic. If your social team's crisis plan starts only when direct messages overflow or when a critical tweet goes viral, you are already playing catch-up. Modern social media customer care requires a shift from transactional ticketing to active social intelligence. You must identify shifts in brand sentiment analysis before they manifest as full-blown public relations emergencies.
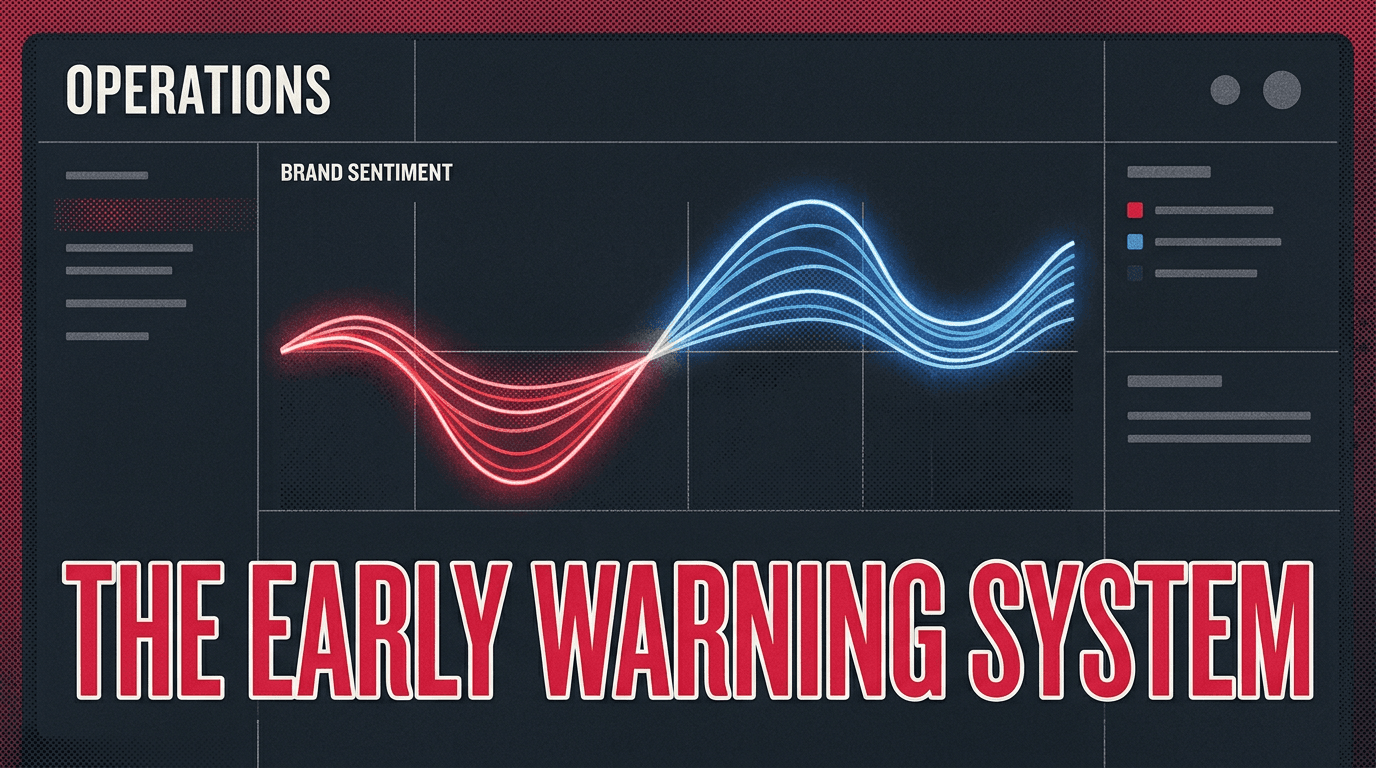
By the end of this guide, you will have a fully operational social intelligence dashboard built on Sprout Social’s latest listening framework. This dashboard will serve as an early-warning system, filtering out background noise to surface genuine reputational threats.
Before you begin, ensure you have the following prerequisites ready:
- An enterprise-level subscription to a social listening tool (this guide focuses on Sprout Social, but the principles apply to Sprinklr or Brandwatch).
- Administrator access to your brand's owned social channels.
- A documented brand crisis escalation matrix (who gets notified at what threshold).
- A historical baseline of your average daily mention volume and sentiment ratios over the last 90 days.
Step 1: Establish Your Baseline Sentiment and Volume Benchmarks
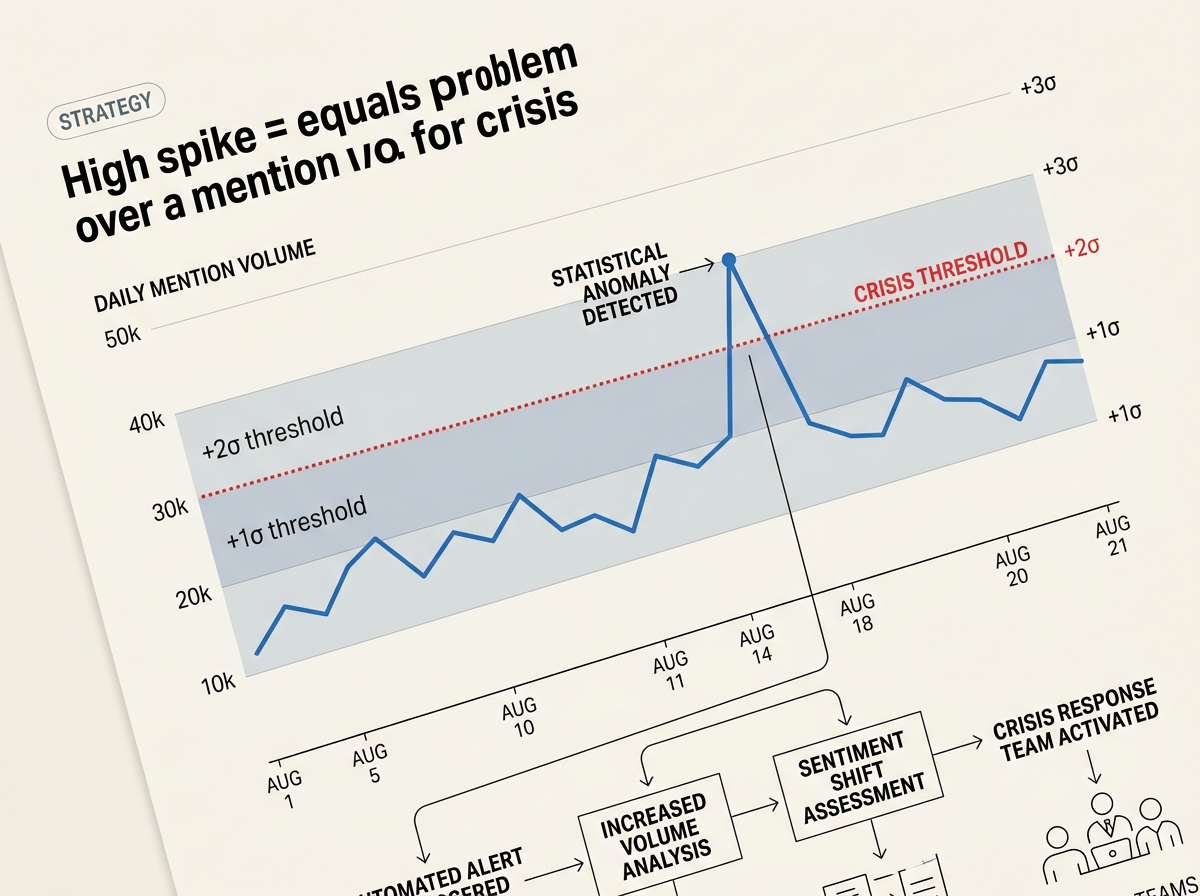
You cannot identify an anomaly if you do not know what normal looks like. The first step in building your social intelligence dashboard is mapping your brand's baseline metrics. This means analyzing historical data to understand your typical daily volume, standard sentiment distribution, and predictable seasonal spikes.
Many brands mistake a high volume of mentions for a crisis. If your brand regularly runs high-engagement campaigns, a 20% spike in mentions is standard. For instance, according to Metricool's 2025 TikTok Marketing Guide [S5], organic reach and engagement rates fluctuate wildly based on video frequency and platform algorithm shifts. If you do not decouple campaign-driven noise from crisis-driven signals, your team will suffer from alert fatigue.
To establish your baseline in Sprout Social:
- Navigate to the Listening tab and select Historical Data.
- Set your date range to the last 90 days. Ensure this window does not contain a major, anomalous crisis event that would skew the average.
- Isolate your owned channels to observe the daily fluctuation of positive, neutral, and negative mentions.
- Calculate your Standard Deviation for daily mention volume. If your average daily mention count is 1,200 with a standard deviation of 150, any single-day volume exceeding 1,500 mentions (two standard deviations) is a statistical anomaly that warrants investigation.
Why it matters
Without a firm baseline, you cannot set accurate automated thresholds. You will either set your alerts too sensitive—triggering notifications every time a minor influencer mentions your product—or too high, missing the slow build of a genuine corporate crisis. Establishing this baseline allows you to configure your social listening tools to ignore the standard daily variations and focus purely on statistically significant deviations.
Common pitfall
Failing to account for campaign-driven volume. When your marketing team launches a major awareness campaign, your baseline will shift. Always cross-reference your listening data with the active paid campaigns run by your media buyers. If you see a sudden rise in neutral or positive mentions coinciding with a new ad set, it is a sign of campaign success, not an incoming crisis.
Step 2: Configure Multi-Tiered Keyword Queries and Exclusions
A crisis dashboard is only as good as the queries powering it. If your search queries are too broad, your dashboard will be flooded with irrelevant data. If they are too narrow, you will miss critical conversations happening on peripheral platforms or forums.
To build a robust query, you must use Boolean logic to create a multi-tiered search structure. This structure must account for your brand name, common misspellings, key executives, product names, and specific crisis-indicator words.
Furthermore, you must account for modern platform dynamics. For example, recent reports on active community management strategies highlight that negative sentiment often starts in the comment sections of short-form video platforms like TikTok before migrating to text-heavy platforms like X (formerly Twitter). Your queries must capture these platform-specific behaviors while filtering out bot activity and fake engagement networks [S1].
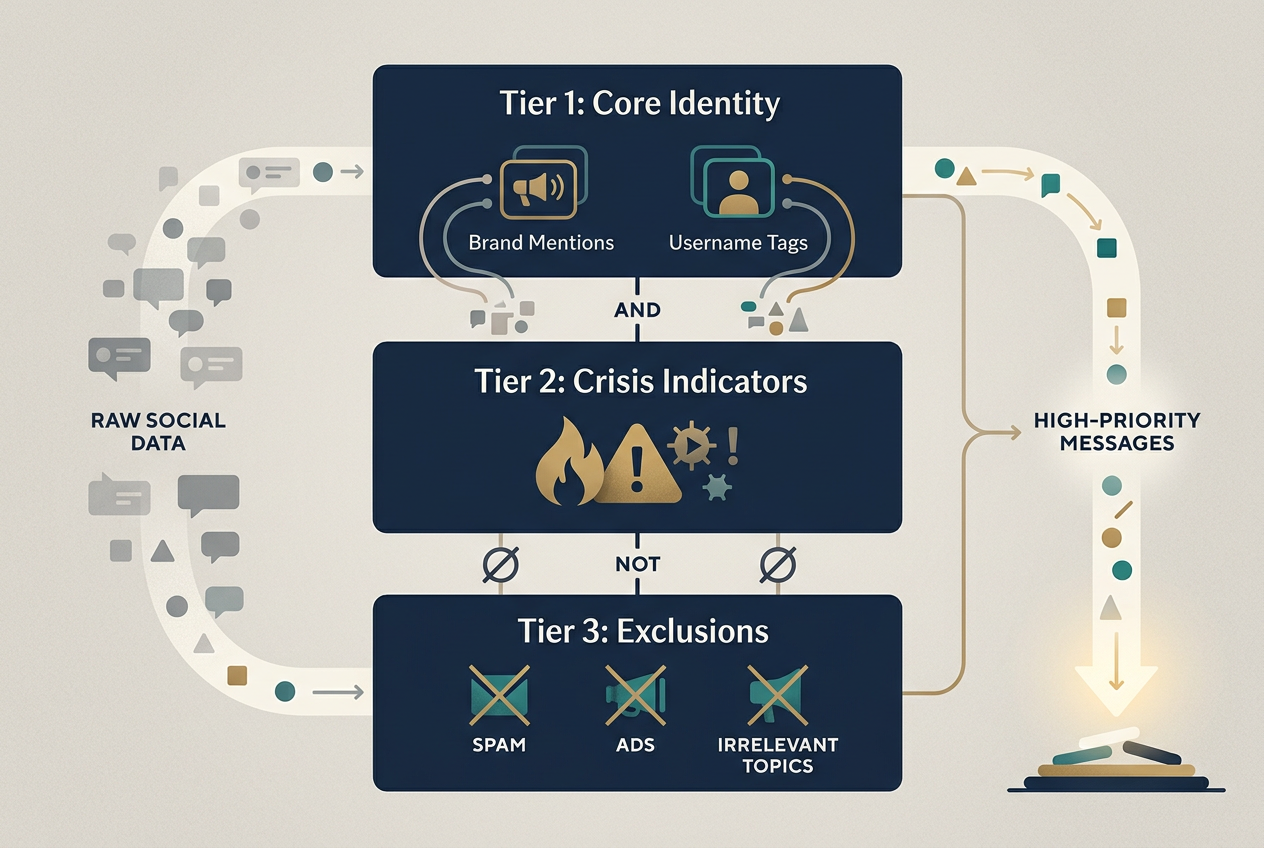
In Sprout Social's Query Builder, construct a three-tiered query:
/* Tier 1: Core Brand Identity */
("BrandName" OR "Brand Name" OR "@BrandHandle" OR "brandname.com")
AND
/* Tier 2: Crisis Indicators */
("scam" OR "fraud" OR "lawsuit" OR "recalled" OR "boycott" OR "toxic" OR "broken" OR "worst" OR "ruined" OR "exploding" OR "poison" OR "injury")
AND NOT
/* Tier 3: Exclusions */
("giveaway" OR "win" OR "sweepstakes" OR "promo" OR "discount")
Why it matters
Refining your queries ensures high-fidelity data. Brand sentiment analysis relies heavily on the context of the words surrounding your brand name. If your query fails to exclude promotional language, your sentiment charts will look artificially positive because of automated bot accounts sharing your giveaway posts. High-fidelity queries isolate the exact conversations where customers are expressing genuine frustration, allowing your social media customer care team to intervene early.
Common pitfall
Neglecting to update your exclusion list. Spammers and bot networks frequently hijack brand hashtags to promote unrelated services, adult content, or cryptocurrency schemes. If you do not aggressively add these hijacked terms to your query's NOT clauses, your crisis dashboard will trigger false alarms based on spam volume rather than actual customer dissatisfaction.
Step 3: Build the Real-Time Crisis Alert and Escalation Matrix
Once your queries are collecting clean data, you must build the mechanism that alerts your team when a crisis begins. You cannot rely on your social managers manually checking the dashboard every hour. A delay of even two hours can allow a localized issue to go global, especially given how rapidly platform algorithms distribute high-engagement negative content [S2, S3].
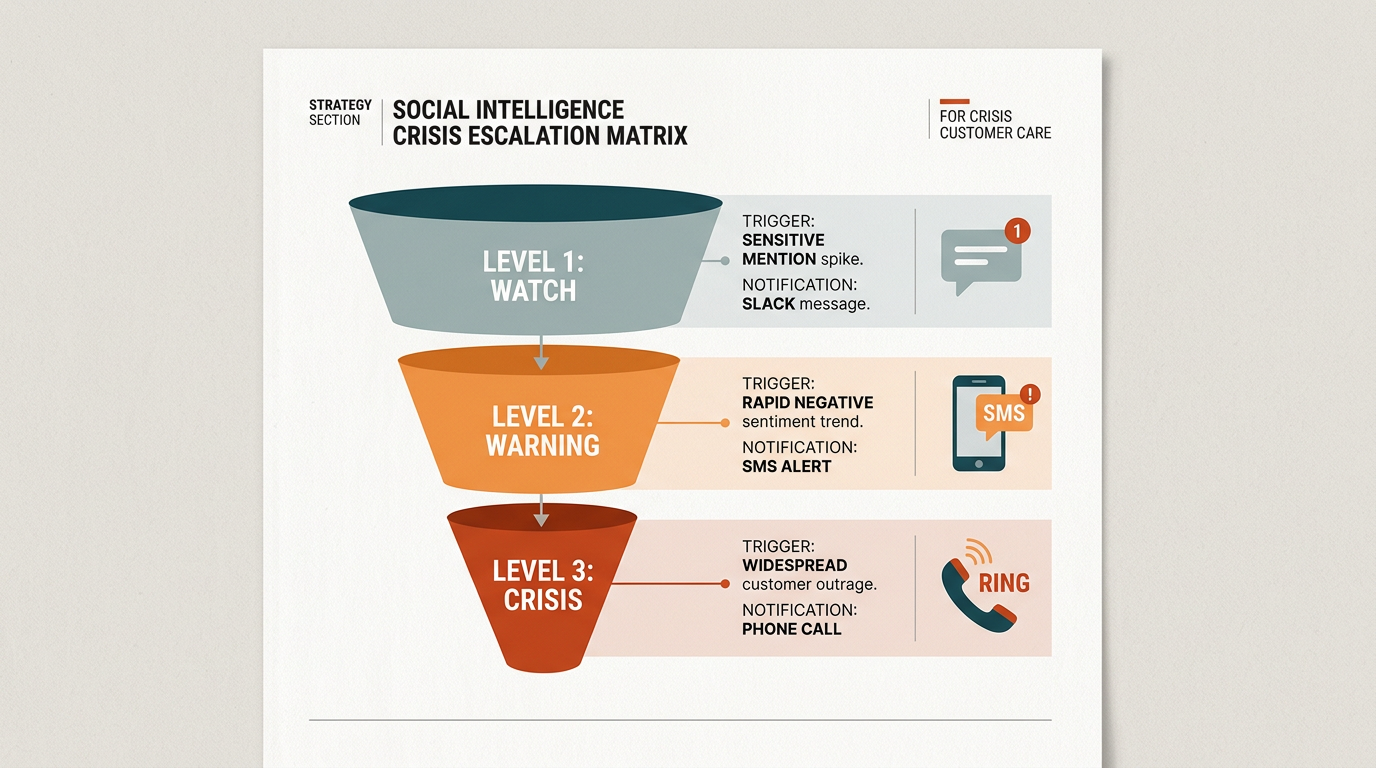
Your alert system must be tied to a clear escalation matrix. Not every sentiment dip requires waking up the VP of Communications at 2:00 AM. You need a tiered notification system based on the severity of the anomaly.
| Alert Level | Trigger Condition | Notification Channel | Required Action | Target Response Time |
|---|---|---|---|---|
| Level 1: Watch | Volume > 1.5x baseline OR negative sentiment > 25% | Slack/Teams Channel | Social Manager monitors thread; tags related posts. | 4 Hours |
| Level 2: Warning | Volume > 2x baseline OR negative sentiment > 40% | Email & SMS to Care Lead | Care Lead reviews raw posts; prepares draft response. | 1 Hour |
| Level 3: Crisis | Volume > 3x baseline OR negative sentiment > 60% | Automated PagerDuty / Phone Call | Activate full crisis response team; pause all scheduled organic posts. | 15 Minutes |
Configure your Sprout Social Inbound Activity Alerts using these specific thresholds. Set up automated alerts to trigger when a Listening Topic experiences a statistically anomalous spike in volume over a rolling 1-hour window.
Why it matters
An escalation matrix prevents organizational panic while ensuring rapid response times for genuine emergencies. It draws a clear line between a standard busy day and an operational crisis. By automating the notification process, you eliminate human hesitation—the moment the data crosses the threshold, the correct stakeholders are notified with the exact context they need to make a decision.
Common pitfall
Sending alerts to a generic shared inbox. If your Level 3 alerts go to a general "marketing@company.com" email address, they will be missed. Alerts must be routed directly to the personal communication channels of the on-call crisis team, such as SMS, Slack direct messages, or dedicated incident management platforms like PagerDuty.
Step 4: Construct the Social Intelligence Dashboard Layout
With your baselines set, queries refined, and alerts configured, you are ready to assemble the visual dashboard. This dashboard must be designed for rapid scanning. During a crisis, executives and stakeholders do not have time to dig through raw data tables; they need to understand the situation in under 30 seconds.
Your dashboard layout should follow a logical hierarchy: high-level health metrics at the top, trend lines in the middle, and raw, high-impact posts at the bottom. This layout allows viewers to instantly see what is happening, how fast it is growing, and who is driving the conversation.
In Sprout Social, create a Custom Listening Dashboard and arrange the widgets in this exact order:
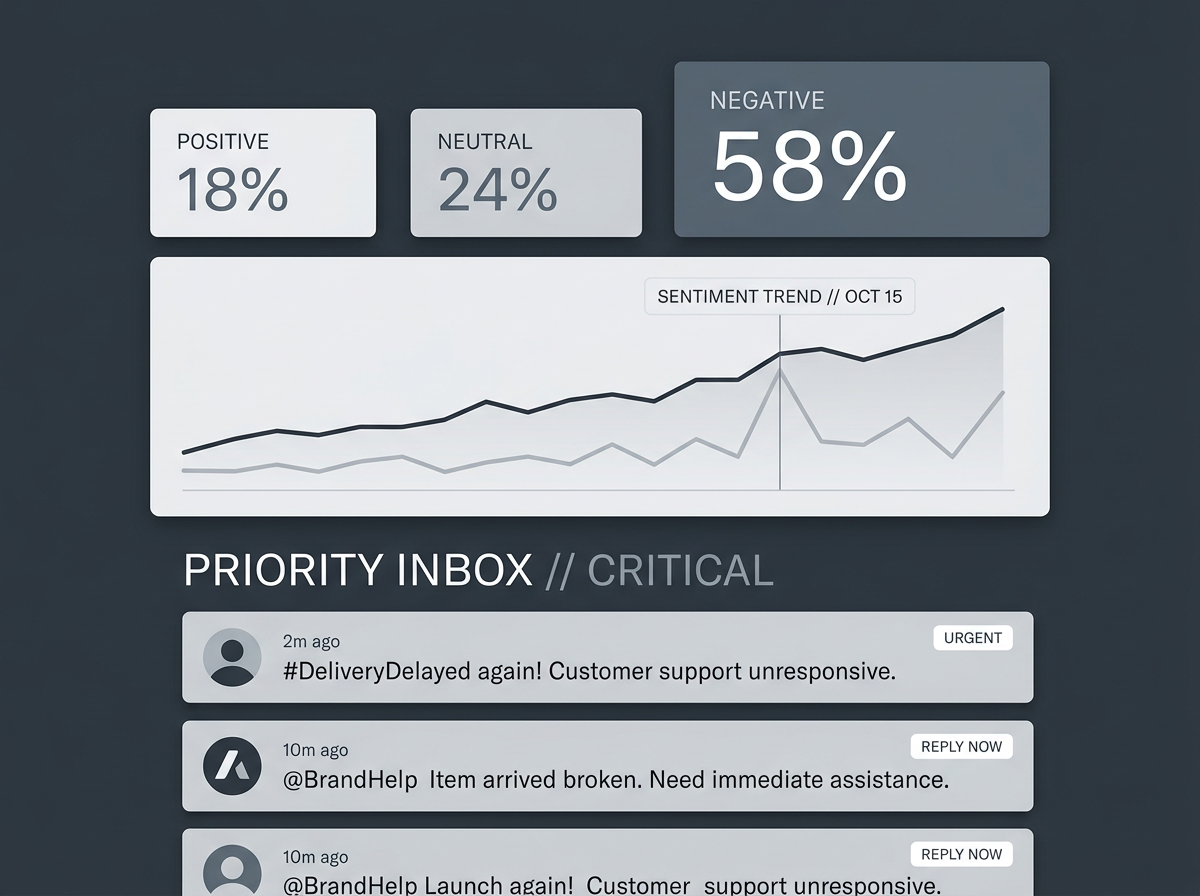
- Summary Cards (Top Row): Total Mention Volume, Net Sentiment Score, and Share of Voice. These cards should display a comparison percentage against your historical baseline.
- Volume & Sentiment Trend Lines (Middle Left): A dual-axis chart showing daily mention volume mapped against positive vs. negative sentiment ratios. Look for the exact point where the sentiment line crosses the volume line—this is your inflection point.
- Platform Breakdown Chart (Middle Right): A breakdown of where the conversation is happening (e.g., X, TikTok, Reddit, Instagram). This tells you where to deploy your response assets. According to Statista's Q1 2025 data [S4], different platforms require vastly different engagement tactics depending on whether the goal is reach or community retention.
- Word Cloud & Topic Clusters (Lower Middle): A visual representation of the most common words appearing alongside your brand name. This helps identify the core issue (e.g., "billing," "outage," "rude," "leak").
- High-Impact Messages Feed (Bottom Row): A live stream of messages filtered by high negative sentiment and high follower count. This highlights the specific posts that are driving the narrative.
Why it matters
A well-designed dashboard translates raw social data into actionable business intelligence. It allows your customer care team to justify their decisions to upper management. If the VP asks why you paused a major product launch campaign, you can show them the dashboard showing negative sentiment spiking to 70% within the last three hours, proving that proceeding with promotional content would be culturally tone-deaf.
Common pitfall
Cluttering the dashboard with vanity metrics. Metrics like total potential reach or cumulative impressions are irrelevant during a crisis. Focus strictly on volume velocity, sentiment shift, and resolution rate. Keep the dashboard focused on the metrics that directly measure the health and recovery of your brand's reputation.
Step 5: Verification: Simulating a Crisis to Test Your Dashboard
Never assume your dashboard works until you have tested it under simulated crisis conditions. A fire drill ensures your queries capture the correct terms, your automated alerts trigger properly, and your team knows how to read the dashboard under pressure.
To run a successful verification simulation, follow this protocol:
- Select a low-traffic testing window: Choose a time when your organic social volume is typically low, such as a Tuesday morning at 9:00 AM.
- Create a controlled test keyword: Choose a unique, non-offensive keyword combination that does not exist in public conversations (e.g., "#BrandNameBetaTestFailure99").
- Temporarily add the test terms to your active queries: Edit your listening topic to include this specific test tag.
- Simulate the spike: Have 10 to 15 team members post public updates across different platforms (X, Instagram, YouTube comments) using the test terms. Instruct them to write posts with varying degrees of negative phrasing to test the sentiment analysis engine.
- Monitor the response:
- Did the volume spike trigger an automated alert within the designated timeframe?
- Did the alert go to the correct Slack channel or team member?
- Did the dashboard correctly classify the test posts as negative or neutral?
- Did the word cloud update to display the unique test terms?
- Revert and clean up: Once verified, remove the test terms from your queries and delete the test posts to keep your historical data clean.
If your alerts triggered within 15 minutes and your dashboard accurately visualized the sudden influx of negative test posts, your social intelligence dashboard is officially operational.
Three Next-Level Tactics to Try Next
Once your core crisis dashboard is live and verified, you can expand your social intelligence capabilities by implementing these advanced tactics:
1. Integrate Competitive Sentiment tracking
Do not monitor your brand in a vacuum. Configure parallel listening topics for your top three competitors. If a competitor experiences a major PR crisis, their displaced customers will look for alternatives. By tracking their negative sentiment spikes, your social media team can coordinate with your paid media buyers to run targeted acquisition campaigns while their brand is vulnerable. For more on how to set up these advanced structures, see our guide on advanced social listening queries.
2. Connect Your Social Listening Data to Your CRM
Bridge the gap between social intelligence and direct customer care. Use integrations (such as Sprout Social’s integration with Salesforce or HubSpot) to pass social sentiment data directly into your customer relationship management system. When a high-value customer posts a negative comment on social media, their support ticket should be automatically escalated in your CRM, alerting their account manager before they churn. This ensures your social insights drive real-world retention efforts.
3. Build a "De-escalation" ROI Model
Prove the financial value of your crisis care program to your executive team. Track the average time it takes your team to resolve a negative mention before it gains viral traction. Map this against your historical cost-per-acquisition and customer lifetime value metrics. By demonstrating that early intervention prevents mass customer churn during a sentiment dip, you can transform your customer care department from a cost center into a documented protector of brand equity. For a deeper look at this methodology, read our framework on measuring social media ROI.
FAQ