


Your CFO does not care about your Reels engagement rate. They do not care that your latest carousel had a 4.2% click-through rate, and they certainly do not care about 'brand sentiment' unless it is tied to a quantifiable risk profile. In the current economic climate—where Pew Research recently found that 1 in 10 webpages already show signs of AI authorship and digital noise is at an all-time high—the C-suite is looking for signal, not static.
If you want to secure a larger budget for Q4, you have to stop speaking the language of a platform manager and start speaking the language of a business owner. This means pivoting from vanity metrics to the 'MBA-speak' of efficiency, retention, and incremental growth. Whether you are an agency lead like those at True North Social or an in-house strategist for a high-growth brand like AG1 or Grüns, the mandate is the same: prove that social media is a profit center, not a cost center.
The Shift from Channel Metrics to Business Outcomes
For years, social media managers have been insulated by the 'awareness' umbrella. We argued that because social is top-of-funnel, it couldn't be measured with the same rigor as direct mail or search. Those days are over. With the deprecation of third-party cookies and the rise of sophisticated Marketing Mix Modeling (MMM), the C-suite expects social to justify its existence alongside every other line item on the P&L.
How to master Marketing Mix Modeling for social
The criteria for this list are simple: metrics must be platform-agnostic, financially rigorous, and directly tied to the company's bottom line. We aren't looking for 'likes'; we are looking for the financial levers that move market share.
1. Customer Acquisition Cost (CAC) by Channel and Cohort
The Metric: The total cost of sales and marketing efforts required to acquire a new customer via social channels.
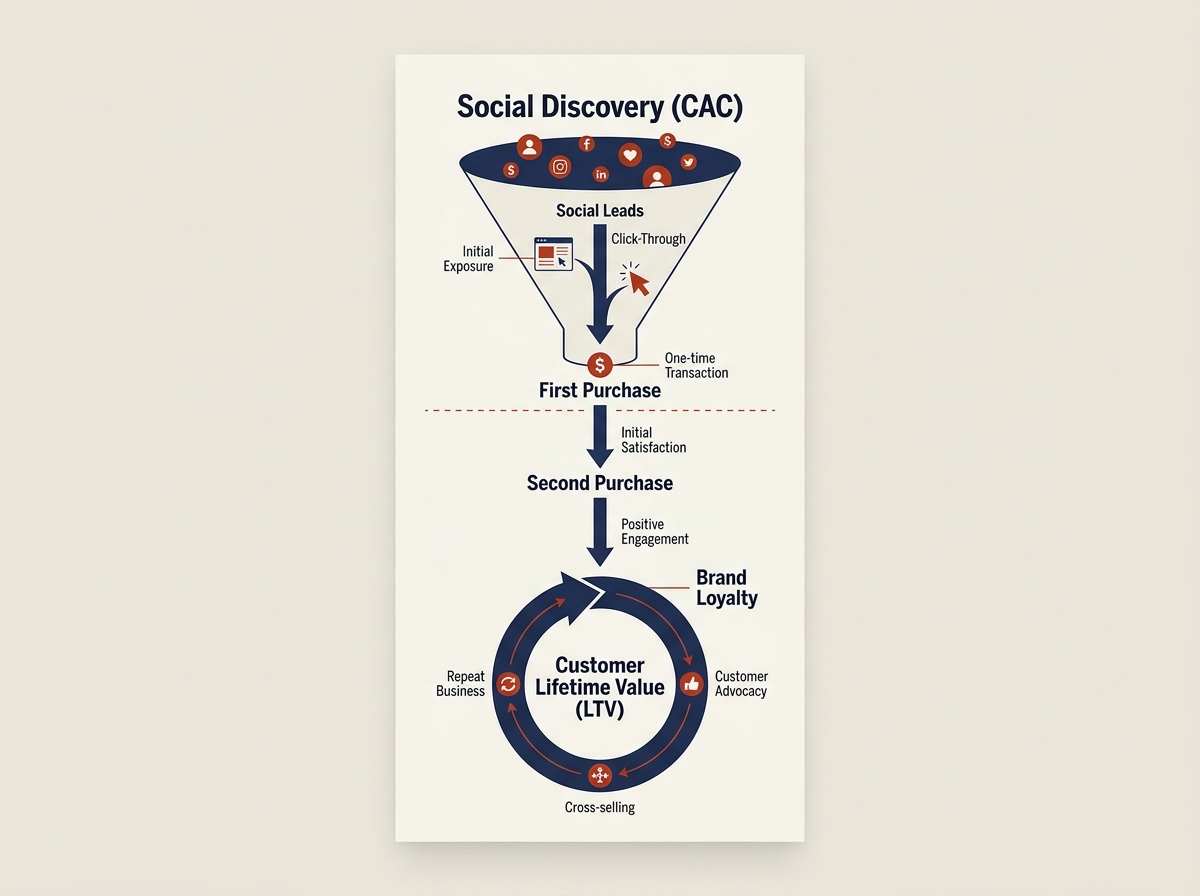
If you aren't calculating your Social CAC, you aren't really marketing; you're just spending. The C-suite views CAC as the primary efficiency metric for growth. However, the mistake most social leads make is reporting a blended CAC. To win buy-in, you must break this down by organic versus paid, and further by specific campaign cohorts.
For example, if you are running a campaign for a supplement brand like Grüns, your CFO needs to know if the CAC for customers acquired via TikTok influencers is lower than those acquired via Meta Advantage+ campaigns. According to internal benchmarks from top-tier agencies, a 'healthy' CAC should ideally be one-third of your LTV, but in the competitive 'gummy' supplement space, brands are often willing to see a 1:1 ratio in the first 90 days to capture market share. You must be able to explain why a higher CAC today leads to a dominant market position tomorrow.
Best for: Paid social buyers and growth leads justifying monthly ad spend increases.
2. Customer Lifetime Value (LTV) and the LTV:CAC Ratio
The Metric: The total revenue a business can expect from a single customer account throughout the business relationship.
LTV is the holy grail of C-suite reporting. It proves that the followers you are acquiring aren't just one-time buyers but long-term assets. Social media is uniquely positioned to drive LTV through community management and retargeting, yet we rarely claim credit for it.
When reporting to the C-suite, use social data to show how community engagement correlates with repeat purchase rates. If a customer follows your brand on Instagram, does their LTV increase by 20%? If so, your 'engagement' suddenly has a dollar value. Use tools like Northbeam or Triple Whale to track these multi-touch journeys. By showing that social-first customers have a higher retention rate than search-first customers, you transform social from a 'top-of-funnel' tool into a 'retention engine.'
Best for: Social media managers and CRM leads looking to prove long-term brand health.
3. Share of Voice (SOV) vs. Market Share
The Metric: The percentage of the total conversation in your industry that is about your brand compared to your competitors.
In the 'gummy wars' between brands like AG1 and their competitors, Share of Voice is a leading indicator of future market share. This is an MBA favorite because it visualizes competitive dominance. If your brand owns 40% of the social conversation in the 'wellness supplement' category but only has 10% of the market share, you have a massive opportunity for conversion.
Conversely, if your market share is high but your SOV is dropping, you are at risk of being disrupted. Use social listening platforms like Brandwatch to track your SOV against top competitors. Presenting a chart that shows your SOV rising while a competitor’s falls is the most persuasive way to argue for 'defensive' budget—spending money now to ensure you don't lose your seat at the table later.
Best for: Brand strategists and CMOs during annual planning sessions.
4. Incremental Return on Ad Spend (iROAS)
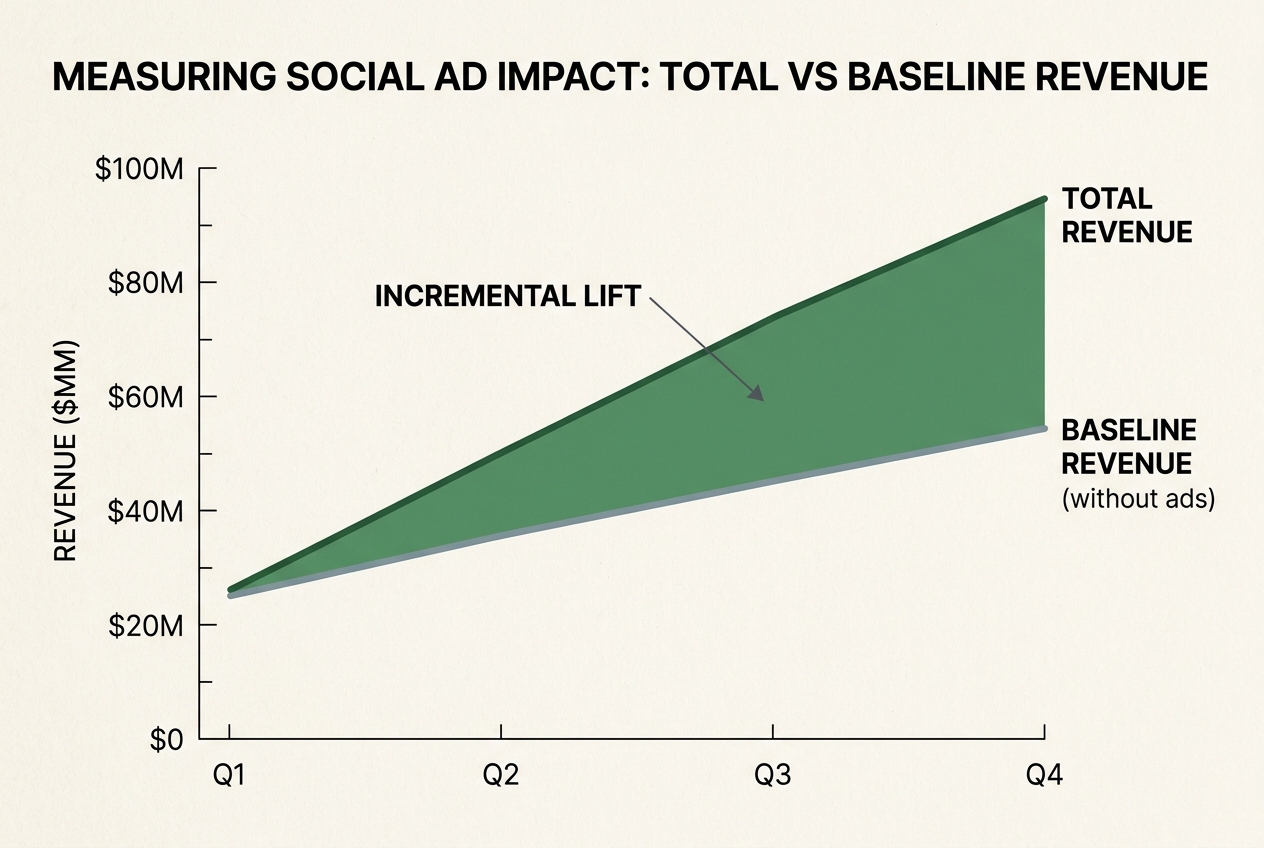
The Metric: The additional revenue generated by social media ads that would not have occurred without them.
Standard ROAS is a lie. Every CFO knows that a significant portion of 'attributed' sales would have happened anyway. iROAS is the truth. It requires running 'lift studies'—turning off ads for a specific geographic region or audience segment to see what happens to the baseline sales.
Platforms like Meta and TikTok have built-in lift study tools, but you should also look at third-party validation. If you can prove that for every $1 spent on social, you generate $1.50 in incremental revenue (revenue that didn't just come from someone who was already going to buy), you will never have your budget cut again. This is about proving causality, not just correlation.
Running a clean Meta Lift Study in 2026
Best for: Data-driven performance marketers and agency leads.
5. Social-Assisted Conversion Value
The Metric: The total value of conversions where social media was a touchpoint but not the final click.
Last-click attribution is the enemy of social media. Because social is often the discovery mechanism, it rarely gets the credit in a standard Google Analytics setup. To win C-suite buy-in, you must use 'Path to Purchase' modeling.
Show the C-suite that while social only 'closed' 5% of sales, it was present in 45% of the total customer journeys. This is the 'assist' in basketball terms. A point guard doesn't get the points for the basket, but the team doesn't score without them. Use GA4’s Model Comparison Tool to show the difference between 'Last Interaction' and 'Linear' or 'Data-Driven' attribution. When the CFO sees that cutting the social budget would lead to a 30% drop in 'Direct' and 'Organic Search' traffic, they will understand the ecosystem's interdependence.
Best for: Strategists at agencies like True North Social who need to justify 'top-of-funnel' awareness spend.
How to Present These Metrics Without Losing the Room
Data is only as good as the story you tell with it. When you walk into the boardroom, don't lead with a spreadsheet. Lead with the business problem.
"We noticed our blended CAC was rising, so we shifted 20% of the budget to high-LTV creator partnerships, which resulted in a 15% increase in incremental revenue."
That sentence contains three of the metrics we discussed and tells a story of proactive management. It shows you aren't just 'posting content'; you are managing a portfolio of digital assets to maximize return.
The Role of AI in 2026 Reporting
As the Pew Research data suggests, the volume of content is exploding due to AI. This makes 'engagement' even less reliable as a metric because bot traffic and AI-generated interactions are skewing the data. As SMM panels like FollowService24 continue to offer cheap, artificial engagement, the C-suite is becoming increasingly skeptical of 'likes' and 'follows.' Your reliance on hard financial metrics like iROAS and LTV is your best defense against the 'dead internet' theory devaluing your work.
Summary: The New Social Dashboard
To move from a tactical executor to a strategic partner, your reporting must evolve. Stop sending PDFs of top-performing posts. Start sending executive summaries that highlight:
- Efficiency: Is our CAC trending down or staying stable relative to scale?
- Growth: Is our Share of Voice outpacing our competitors?
- Profitability: What is the iROAS of our latest campaign?
- Retention: Are social-sourced customers staying longer and spending more (LTV)?
By adopting these MBA metrics, you aren't just reporting on social media; you are reporting on the health and future of the business. That is how you win the room, and that is how you win the budget.
The 2026 Guide to Creator Economy Economics
FAQ