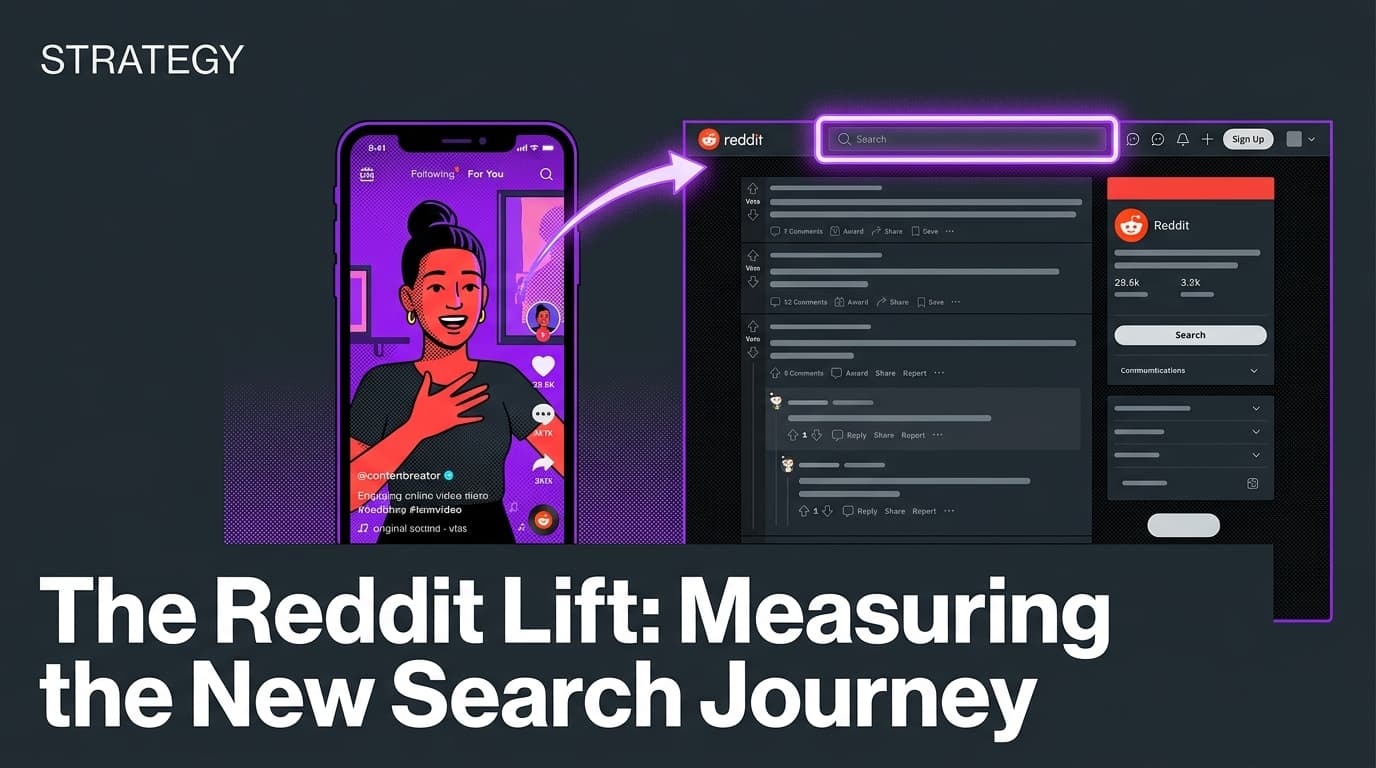

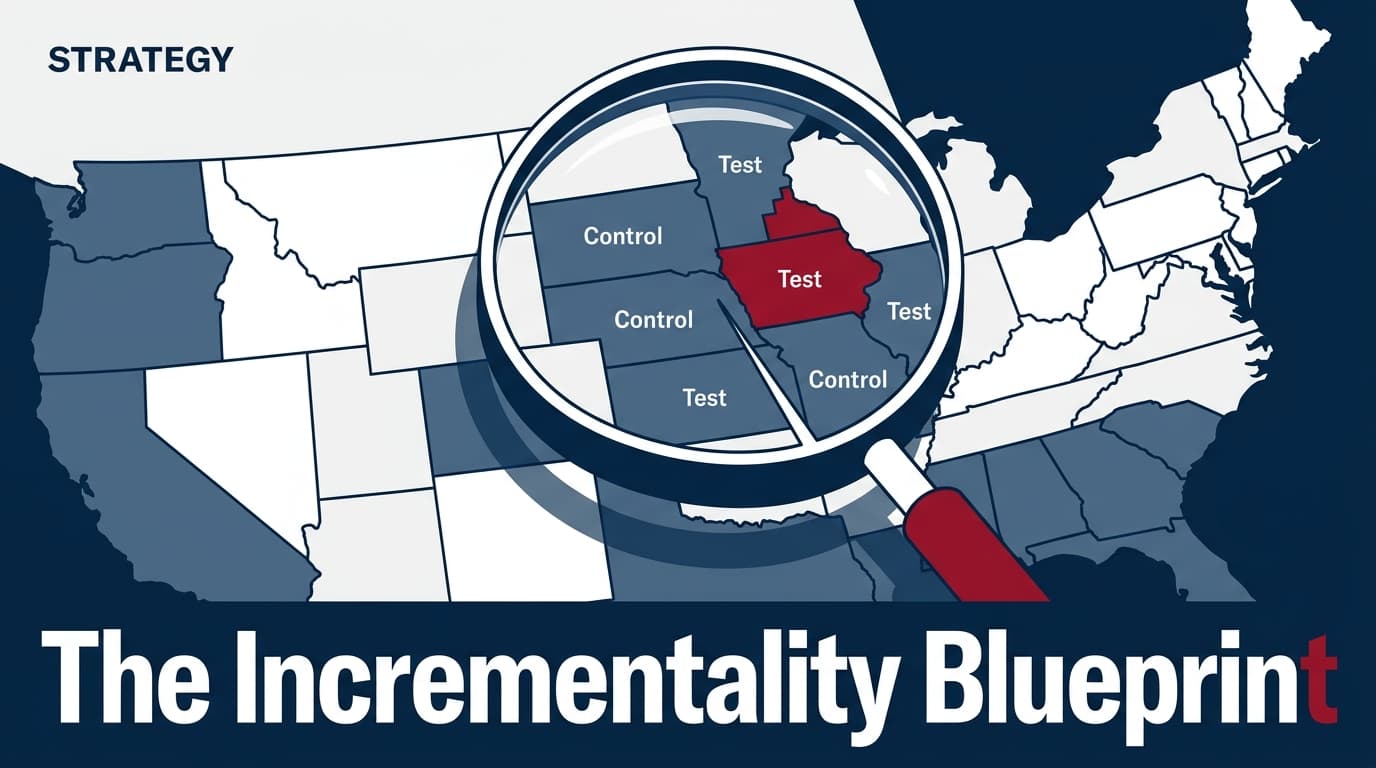
By the time you finish this guide, you will have a reproducible framework for proving that your social media spend—both organic and paid—is actually driving revenue that your current attribution software is missing. Most social media managers are still trapped in the 'last-click' cage, defending their budgets with platform-reported ROAS that the finance team doesn't believe. We're moving past that. You don't need a $50k-a-month data science team to run a credible incrementality test; you just need a controlled environment and the discipline to stop spending in specific places for a short window.
Why it matters: As privacy regulations tighten and platforms like TikTok face shifting demographics due to regional age-gate policies (as seen in the July 2026 social media bans for minors in several EU territories), the 'signal' in your pixel is fading. If you can't prove that your $10,000 TikTok spend is driving a $20,000 lift in 'Direct' and 'Organic Search' traffic, your budget is the first to be cut when the economy cools.
Key takeaways
- Shift from tracking to testing: Stop asking 'which click did this?' and start asking 'what would have happened if we didn't show this ad?'
- Geo-holdouts are the gold standard: Use matched-market testing to isolate the impact of social spend on total business revenue.
- Correlation isn't causation, but it's a start: Use spend-correlation models to map 'unattributed' search spikes to your social flighting.
- Prepare for Q4 now: Incrementality tests require a 'clean' baseline; you must run these before the November madness begins.
Step 1: Define your 'Ghost' markets and baseline periods
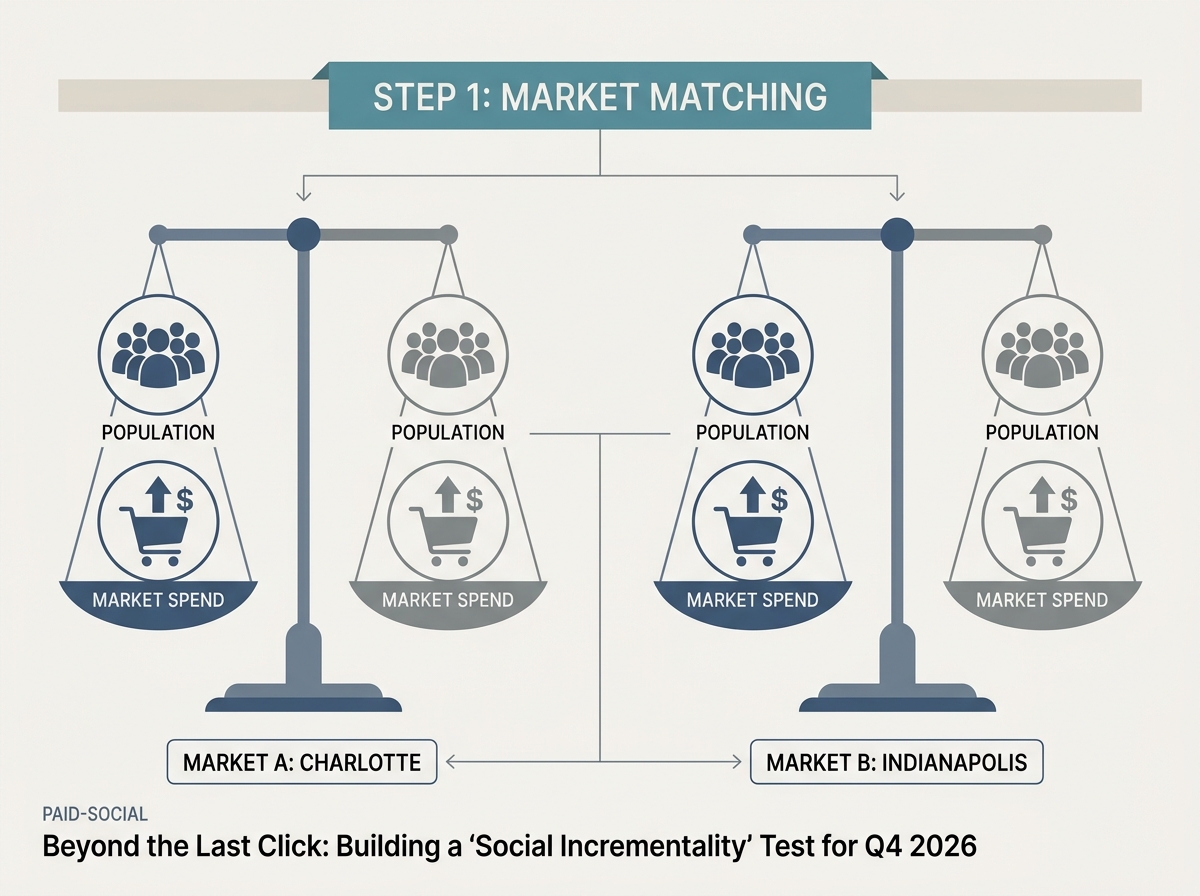
The foundation of a geo-holdout test is selecting two regions that behave similarly but are geographically distinct. You aren't just looking for similar populations; you're looking for similar purchase behavior. If you are a US-based retailer, you might pair Charlotte, NC with Indianapolis, IN. They have comparable CPMs and historical conversion rates.
You need at least four weeks of 'clean' historical data where spending was consistent in both markets. This is your baseline. During the test period, you will maintain 'business as usual' (BAU) in Market A (the Control) and completely dark out or significantly scale in Market B (the Test).
Why it matters: Without a control group, you can't account for external factors. If you run a TikTok campaign during the release of a major cultural event—like the brand tie-ins we saw for Christopher Nolan’s The Odyssey in July 2026—your sales might spike across the board. A geo-holdout allows you to subtract that 'cultural lift' from the 'platform lift.'
Common Pitfall: Choosing markets that have significant overlap in local media or regional logistics. Don't pick New York and Philadelphia; the media bleed is too high. Choose isolated DMAs (Designated Market Areas) to ensure your 'dark' market is truly dark.
Step 2: Implement the 'Social Dark' window
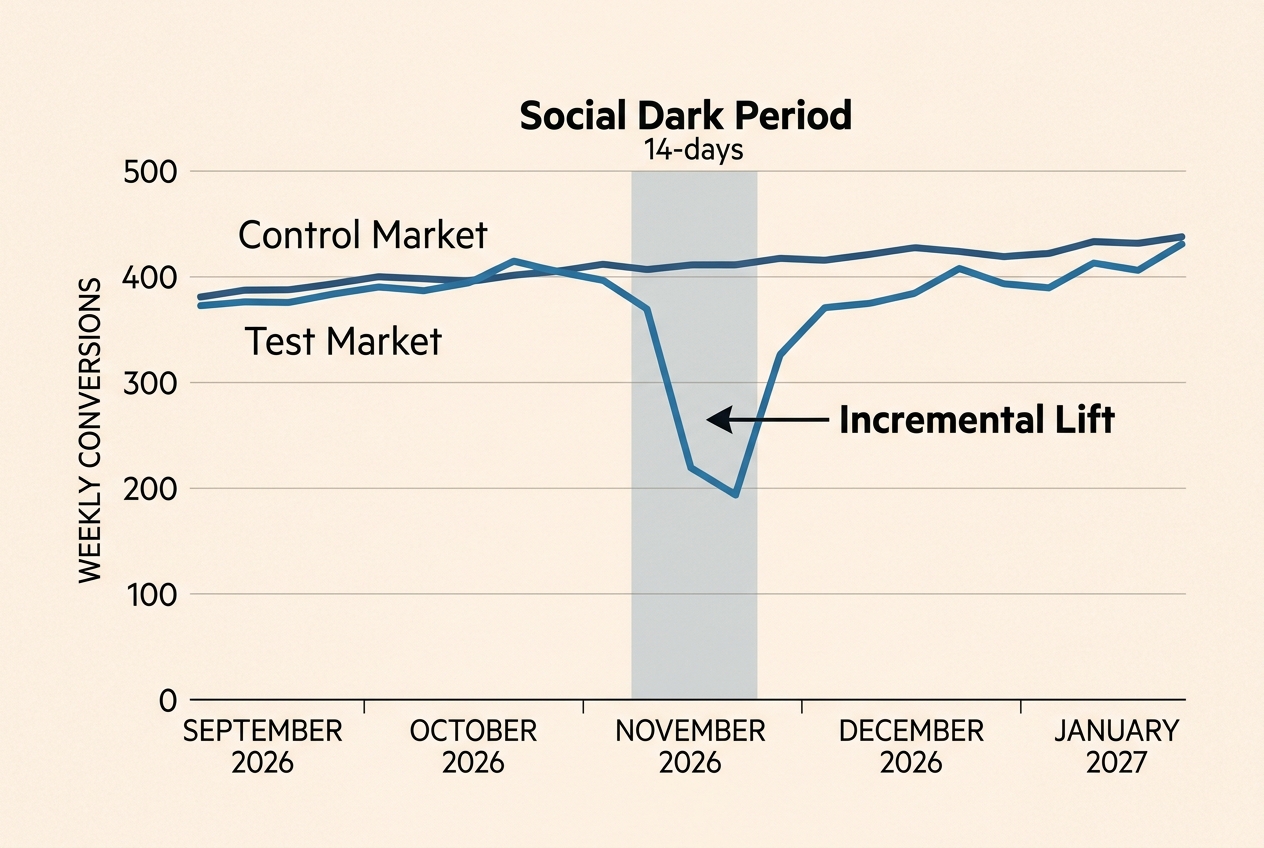
This is the hardest part for most marketers: you have to turn the ads off. For a period of 14 to 21 days, you will set your social spend to zero in your Test Market. This includes Meta, TikTok, and even Pinterest. If you are testing organic lift, you must geofence your organic posts if the platform allows, or focus purely on the paid side if you cannot control organic distribution.
During this window, you are monitoring 'Total Revenue' in that specific geo. You aren't looking at GA4's social channel; you are looking at the bottom line. If your total revenue in Indianapolis drops by 15% while Charlotte (where ads stayed on) remains flat, you have just found your incrementality. That 15% is the 'unattributed' lift your social ads were providing.
Why it matters: Google's recent removal of the $50k spend rule for lead form ads (July 2026) has flooded the mid-funnel with cheap leads, but many of these are low-intent. A holdout test proves whether your social ads are actually warming up the top of the funnel or just 'stealing' credit from people who were going to buy anyway.
Common Pitfall: Failing to notify the rest of the marketing team. If the SEO team launches a massive local backlink campaign in your Test Market at the same time you go 'social dark,' your data is junk. Lock down all variables.
Step 3: Map 'Unattributed' search volume to social flighting
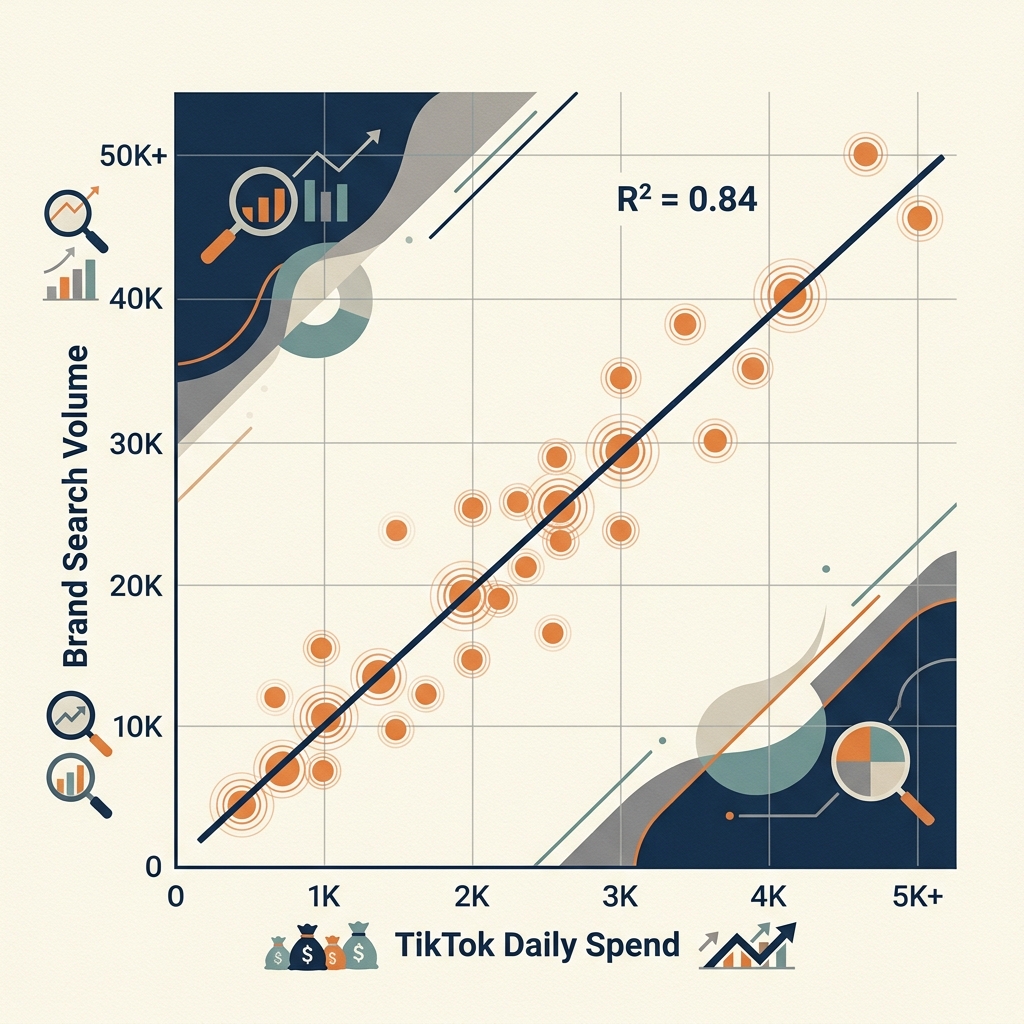
We know that people see a TikTok and then go to Google to search for the brand. This shows up as 'Organic Search' or 'Direct' in your analytics, giving Google the credit for a sale TikTok actually started. To measure this, use a spend-correlation model.
Take your daily TikTok spend and overlay it against your daily 'Brand Search' impressions in Google Search Console. We are looking for a 'lead-lag' relationship. Typically, a spike in social spend is followed 24–48 hours later by a spike in brand searches. By calculating the R-squared value of these two data sets, you can present a mathematical argument to your CFO: 'For every $1,000 we spend on TikTok comedy videos—similar to the successful golf shop campaigns seen in New Zealand this year—we see a 12% lift in brand search volume.'
Why it matters: This bridges the gap between the social team and the search team. Instead of fighting over the budget, you're proving that social is the fuel for the search engine.
Common Pitfall: Ignoring the 'halo effect' of high-performing organic content. If a video goes viral, it will skew your paid correlation. You must track 'Total Social Impressions' (Paid + Organic) against search volume for the most accurate picture.
Step 4: Calculate your 'True CAC' and 'Incremental ROAS'
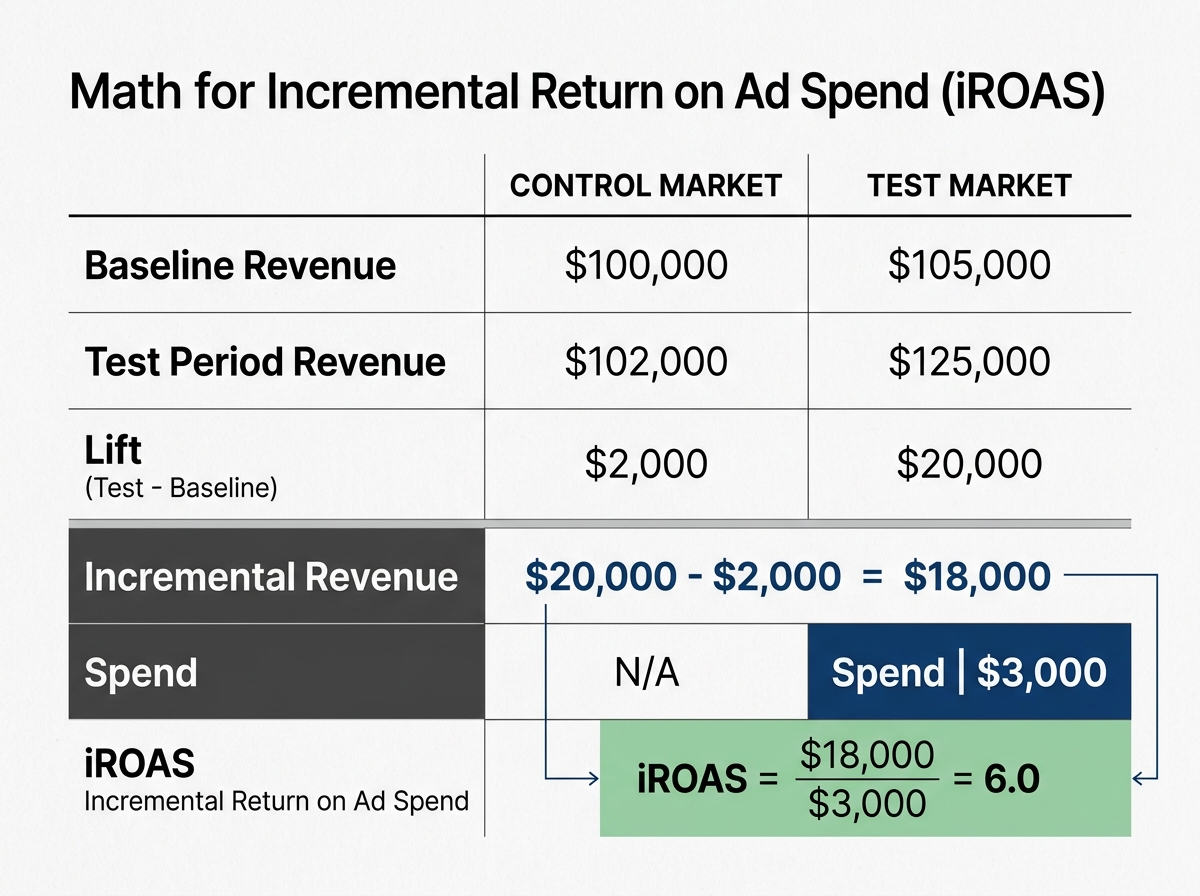
Now for the math. Once your test period is over, you calculate the lift.
Incremental Sales = (Control Market Sales during test / Control Market Sales during baseline) * (Test Market Sales during baseline) - (Test Market Sales during test)
If the result is positive, that is the number of sales you lost by turning off ads. Divide your total spend by these incremental sales to get your Incremental Cost Per Acquisition (iCPA).
Compare this to your 'Blended CAC' from GA4. You will likely find that while your platform-reported ROAS was a 4.0, your Incremental ROAS is a 2.5. This isn't bad news—it's the truth. A 2.5 iROAS is often more valuable than a 'fake' 10.0 ROAS because it represents real growth, not just credit-claiming.
Why it matters: In the current climate of 'Moment Marketing,' where brands are jumping on trends in real-time, budgets are often wasted on 'retargeting' people who were already in the checkout flow. iROAS tells you if you're actually finding new customers.
Common Pitfall: Running the test for too short a window. For high-consideration products (anything over $100), a 7-day test is useless. You need at least two full purchase cycles to see the impact of the dark window.
Step 5: Verify results with 'Post-Purchase Surveys'
How do you know the math is right? You ask the customers. Implement a 'How did you hear about us?' (HDYHAU) survey on your 'Thank You' page. Use an open-text field, not a dropdown.
When a customer writes 'I saw that funny video of the guy hitting a golf ball into a toaster' (referencing the TikTok comedy trend), and GA4 says they came from 'Direct,' you have qualitative proof of your incrementality. Match your survey data percentages against your geo-holdout percentages. If 20% of 'Direct' customers say they found you on social, and your geo-test showed a 20% lift, you have 'triangulated' the truth.
Why it matters: Data can be manipulated, but customer voices are harder to dismiss in a boardroom. This provides the 'why' behind the 'what' of your geo-testing.
What to try next
Once you've mastered the basic geo-holdout, you can refine your measurement stack with these three tactics:
- Platform-Specific Lift Tests: Use Meta's 'Conversion Lift' or TikTok's 'Brand Lift' tools simultaneously with your geo-test to see if the platform's internal modeling matches your external findings.
- Media Mix Modeling (MMM): For brands spending over $1M/year, start feeding your geo-test results into an MMM like Robyn (Meta's open-source tool) or LightweightMMM (Google's version). This helps predict future performance based on historical lift.
- Creative Incrementality: Run two different creative styles (e.g., 'UGC-style' vs. 'High-Production') in two different test markets to see which style drives more incremental search volume.
Measuring social ROI in 2026 isn't about finding the perfect pixel; it's about having the courage to turn the lights off so you can see who's still in the room.
FAQ