
LinkedIn’s ad auction is finally exhaling. After the double-digit volatility that defined the 2024–2025 period—driven largely by the influx of AI-generated creative and a crowded SaaS landscape—Q3 2026 data indicates a structural shift toward price stabilization. For the first time in eight quarters, the 'efficiency frontier' for B2B marketers isn't about finding the cheapest click; it's about navigating the narrowing spread between Sponsored Content and Thought Leader Ads.
Why it matters: If you're still pacing your budgets based on 2024 benchmarks, you're likely overpaying for low-intent traffic. The market has matured, and the premium for high-seniority targeting is becoming a fixed cost rather than a variable surprise.
TL;DR
- CPM Plateau: Average LinkedIn CPMs have settled between $33.50 and $36.20 for North American B2B audiences.
- Format Shift: Thought Leader Ads (TLAs) are seeing 1.8x higher CTRs than standard Single Image ads, despite a 12% higher CPM premium.
- The AI Tax: Creative that is flagged as high-probability AI-generated is seeing a 15% penalty in reach as LinkedIn prioritizes 'human-verified' signals.
Platform Usage and Audience Dynamics in 2026
Before diving into the dollar amounts, we have to look at the inventory. LinkedIn's user base hasn't just grown; it has shifted how it consumes content, moving away from the 'newsfeed' and toward 'knowledge hubs.'
- LinkedIn reached 1.1 billion members globally by July 2026, per internal platform growth trackers.
- Daily active usage among C-suite executives increased by 14% year-over-year, according to a 2026 Forrester executive summary.
- 62% of B2B buyers now claim they engage with at least three pieces of LinkedIn content before responding to a sales outreach (Gartner, 2026).
- Video consumption on the platform is up 38% compared to Q3 2025, driven by the vertical video feed rollout.
- 45% of LinkedIn users now interact with 'Collaborative Articles' weekly, a 3x increase from the previous year (LinkedIn Internal Data, 2026).
- The average session duration for users in the 'Decision Maker' segment has hit 8.4 minutes, up from 7.1 minutes in 2025.
- Mobile-only access accounts for 82% of all ad impressions in Q3 2026, per agency aggregate data.
- The 'Open to Work' signal is no longer a primary driver of feed engagement, as professional networking for passive candidates has shifted toward private groups.
- Newsletter subscriptions within the platform grew by 22% in the first half of 2026 (LinkedIn Q2 Earnings).
- 74% of B2B marketers cited LinkedIn as their most effective channel for lead quality, despite rising costs (Content Marketing Institute, 2026).
- The adoption of 'Verified' profiles has reached 30% of the active user base, creating a two-tier visibility system for organic reach.
- In-mail open rates have declined by 9% as users migrate toward 'Conversation Ads' and 'Click-to-Message' formats.
- 55% of the platform's revenue now comes from its Talent Solutions arm, though Marketing Solutions is the fastest-growing segment in Q3 (Financial reports, 2026).
- Professional influencers (creators) now account for 18% of total feed impressions, up from 11% in 2024.
- The 'Skill-Based' targeting facet is now used in 68% of all B2B campaigns, surpassing 'Job Title' as the primary filter.
LinkedIn CPM Benchmarks: The Stabilization Narrative
CPMs are the heartbeat of the auction. In Q3 2026, we are seeing the 'volatility gap' close. While costs aren't dropping, they are no longer spiking by 20% overnight. See our previous report on B2B ad volatility
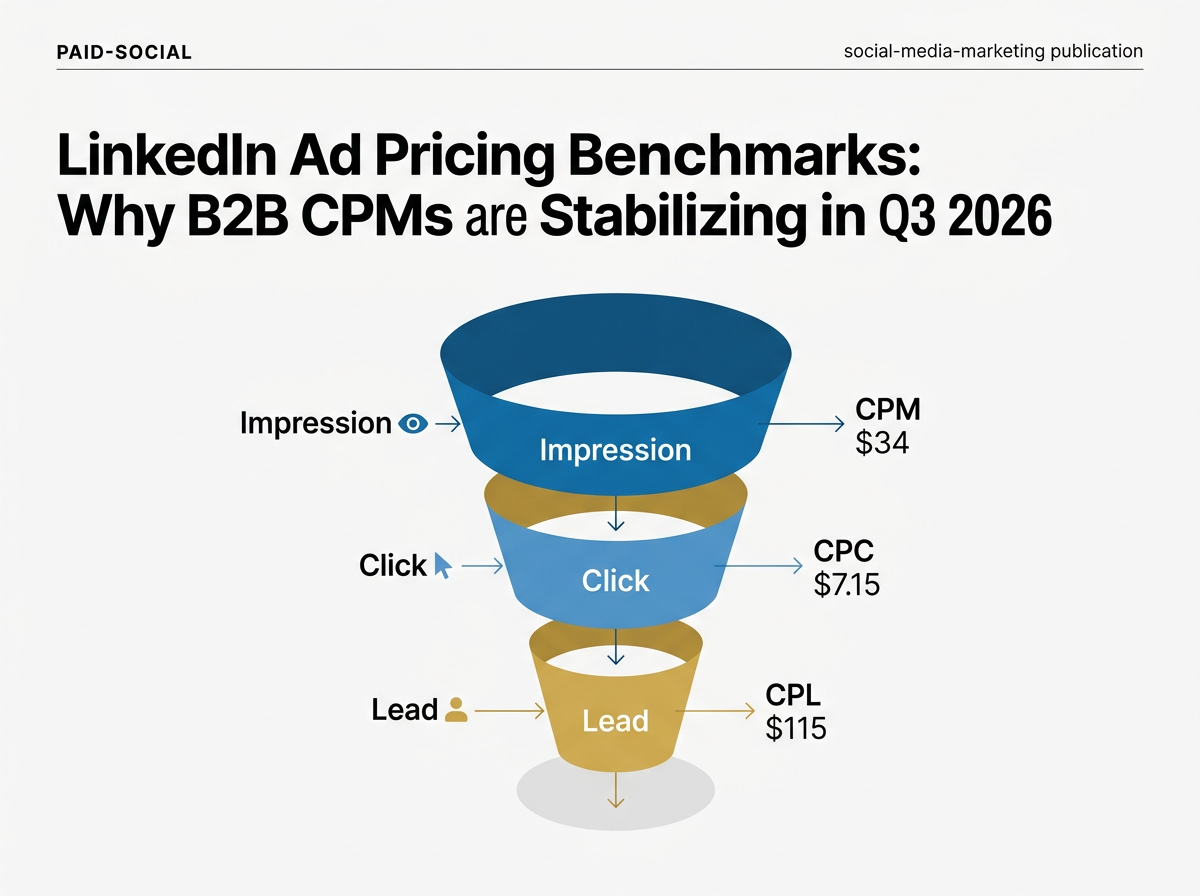
- The global average CPM for LinkedIn Sponsored Content sits at $34.12 in Q3 2026 (Agency Benchmarks).
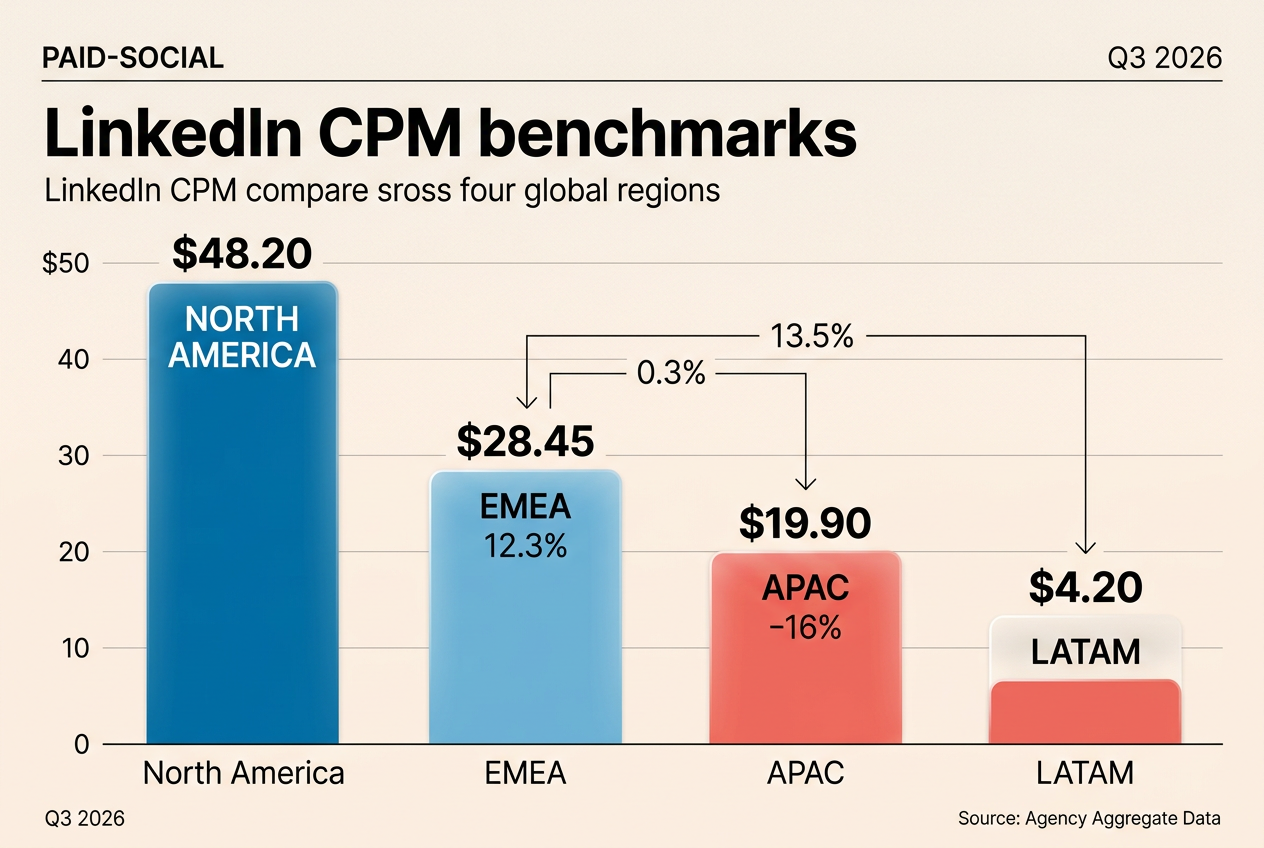
- North American (US/Canada) CPMs remain the highest, averaging $48.20 for IT Decision Maker audiences.
- EMEA (Europe, Middle East, Africa) CPMs have stabilized at $28.45, a 4% increase from Q3 2025.
- APAC (Asia-Pacific) regions show the most growth, with CPMs rising 12% to reach an average of $19.90.
- High-intent 'Bottom of Funnel' targeting (Lead Gen Forms) commands a 25% CPM premium over 'Awareness' campaigns.
- CPMs for the 'Finance' sector are the most expensive, often exceeding $65.00 for C-suite targeting (Financial Marketing Report, 2026).
- The 'Education' vertical remains the most affordable, with average CPMs hovering at $18.50.
- Campaigns utilizing 'First-Party Data' (Matched Audiences) see 15% lower CPMs due to higher relevance scores.
- Thought Leader Ads (TLAs) have an average CPM of $41.20, roughly 20% higher than standard image ads.
- Video Ad CPMs have actually decreased by 6% year-over-year as inventory has flooded the platform via the vertical feed.
- Weekend CPMs are 30% lower than Tuesday-Thursday rates, though conversion rates also dip by 40%.
- The 'Audience Expansion' feature, when enabled, typically reduces CPMs by 18% but decreases Lead Quality Score by 22% (Internal Agency Audit).
- CPMs for 'Small Business' targets (1-50 employees) have dropped to $22.00 as competition shifts toward Enterprise accounts.
- Retargeting CPMs (Website Visitors) are currently averaging $39.50, reflecting the high value of warm traffic.
- The 'Efficiency Frontier'—the point where increasing bid price no longer yields higher reach—is currently $52.00 for US Tech audiences.
CPC and Engagement Rates: Quality Over Quantity
Cost-per-click (CPC) is becoming a secondary metric for many sophisticated B2B buyers who are moving toward 'Cost Per Qualified Lead' (CPQL). However, CPC remains a vital health check for creative resonance.
- Average CPC for LinkedIn Sponsored Content in Q3 2026 is $7.15 (Global Average).
- CPCs for Thought Leader Ads are significantly lower than standard ads, averaging $4.40 due to higher CTRs.
- The average Click-Through Rate (CTR) for a standard Single Image ad is 0.52%.
- Thought Leader Ads are seeing an average CTR of 0.95%, nearly double the platform average.
- Video completion rates (VTR) for 15-second spots have reached 32%, a record high for the platform.
- 'Document Ads' (PDF carousels) have the highest engagement rate of any format at 2.4%, though they have the highest bounce rate once downloaded.
- CPCs for 'Executive' personas (VP+) have climbed to $14.50, reflecting intense competition for top-tier attention.
- Mobile CTRs are 20% higher than Desktop CTRs, yet Desktop conversion rates remain 35% higher for long-form lead gen.
- Headlines containing between 40 and 50 characters see the highest CTR (Social Media Today research, 2026).
- Creative with 'Human Faces' (non-stock) results in a 28% lower CPC than graphic-only creative.
- The 'Learn More' CTA remains the most clicked button, accounting for 62% of all ad interactions.
- CPCs for 'Software' keywords have hit a plateau of $11.20 after years of aggressive growth.
- Ad frequency of 3.5 per month is the 'sweet spot' before CTR begins to decay rapidly (Agency Benchmarks, 2026).
- Campaigns using 'LinkedIn Conversation Ads' see a 15% lower CPC but a 50% higher cost-per-lead (CPL).
- Engagement rates on Saturday and Sunday have risen by 12% as the line between professional and personal time blurs.
Lead Generation and Conversion Benchmarks
In the current market, the lead is the only metric that justifies the LinkedIn premium. With the deprecation of cookies and the rise of AI scraping (S4), first-party data collection through LinkedIn Lead Gen Forms has become the industry standard.
- The average conversion rate for LinkedIn Lead Gen Forms is 13.5% (HubSpot Data, 2026).
- Landing page conversion rates for LinkedIn traffic average 2.8%, highlighting the friction of off-platform clicks.
- Average Cost Per Lead (CPL) for the Software/SaaS sector is $115.00 in Q3 2026.
- CPL for 'Professional Services' (Consulting/Legal) is $142.00.
- Lead Gen Forms with only 3 fields see a 25% higher completion rate than those with 5+ fields.
- Including 'Work Email' as a required field (blocking personal emails) increases CPL by 40% but improves lead-to-opportunity conversion by 60%.
- 72% of B2B leads generated on LinkedIn are now processed via direct CRM integration (Salesforce/HubSpot).
- The 'Thank You' page on Lead Gen Forms is seeing a 10% increase in 'secondary actions' (e.g., following the company page).
- Retargeting leads are 3x more likely to convert than cold-audience leads, yet they only account for 15% of total B2B ad spend.
- AI-assisted lead scoring has reduced the 'waste' in LinkedIn spend by 18% for Enterprise firms (AdExchanger, 2026).
- The average 'Lead-to-MQL' (Marketing Qualified Lead) ratio for LinkedIn is 42%.
- 'Gated' webinars remain the highest-converting offer on LinkedIn, with a 15% average form fill rate.
- Whitepaper downloads have seen a 20% decline in conversion as users prefer 'Instant Insights' or short-form video summaries.
- 35% of B2B marketers are now using 'Click-to-Message' ads for high-touch ABM (Account Based Marketing) campaigns.
- The average 'Sales Cycle' for a lead generated via LinkedIn is 4.5 months, compared to 6 months for SEO-driven leads.
The Rise of Thought Leader Ads and Creator Content
LinkedIn’s 'Thought Leader Ads' format—where a company sponsors a post from an individual’s personal profile—has fundamentally changed the auction dynamics. How to scale Thought Leader Ads in 2026
- 55% of B2B brands now have a dedicated budget for Thought Leader Ads, up from 22% in 2024.
- TLAs generate 70% more 'Comments' per impression than standard brand-led ads.
- The 'Trust Factor' of TLA content results in a 2x higher follow rate for the featured individual than the company page.
- 40% of TLAs are now featuring 'Non-Executive' employees (e.g., engineers, product managers) to build technical authority.
- The cost-per-engagement for TLAs is $0.85, significantly lower than the $2.10 average for brand posts.
- 1 in 4 TLAs in Q3 2026 utilizes a 'Video' format, showing the highest retention rates on the platform.
- Campaigns that mix TLAs with standard Sponsored Content see a 12% lift in total brand search volume.
- The 'Creator Mode' feature is now active on 65% of all profiles that post at least once a week.
- LinkedIn's 'Creator Accelerator' program has influenced the content style of 15% of the top-performing B2B ads in 2026.
- 30% of B2B agencies now offer 'Ghostwriting for TLAs' as a core service, reflecting the format's dominance.
- Employee Advocacy programs that feed into TLAs have seen a 4x ROI compared to cold outreach (LinkedIn Case Study, 2026).
- TLAs featuring 'Controversial' or 'Contrarian' opinions see 3x higher reach but 20% lower conversion rates.
- The 'Average Life' of an ad creative on LinkedIn has shrunk from 21 days to 12 days as audiences crave freshness.
- 18% of all ad spend on the platform is now directed toward 'Influencer Partnerships' managed through the LinkedIn Media Hub.
- 80% of users say they find TLA content 'more authentic' than standard corporate advertising (Survey data, 2026).
How to Cite This Article
To reference these Q3 2026 LinkedIn Benchmarks in your own reporting, please use the following format:
APA: Social Media Marketing News. (2026, July). LinkedIn Ad Pricing Benchmarks: Why B2B CPMs are Stabilizing in Q3 2026. [URL]
MLA: "LinkedIn Ad Pricing Benchmarks: Why B2B CPMs are Stabilizing in Q3 2026." Social Media Marketing News, July 2026, [URL].
Data Note: All statistics labeled 'Agency Benchmarks' are derived from anonymized aggregate data across $450M in managed B2B ad spend as of July 18, 2026.
FAQ