
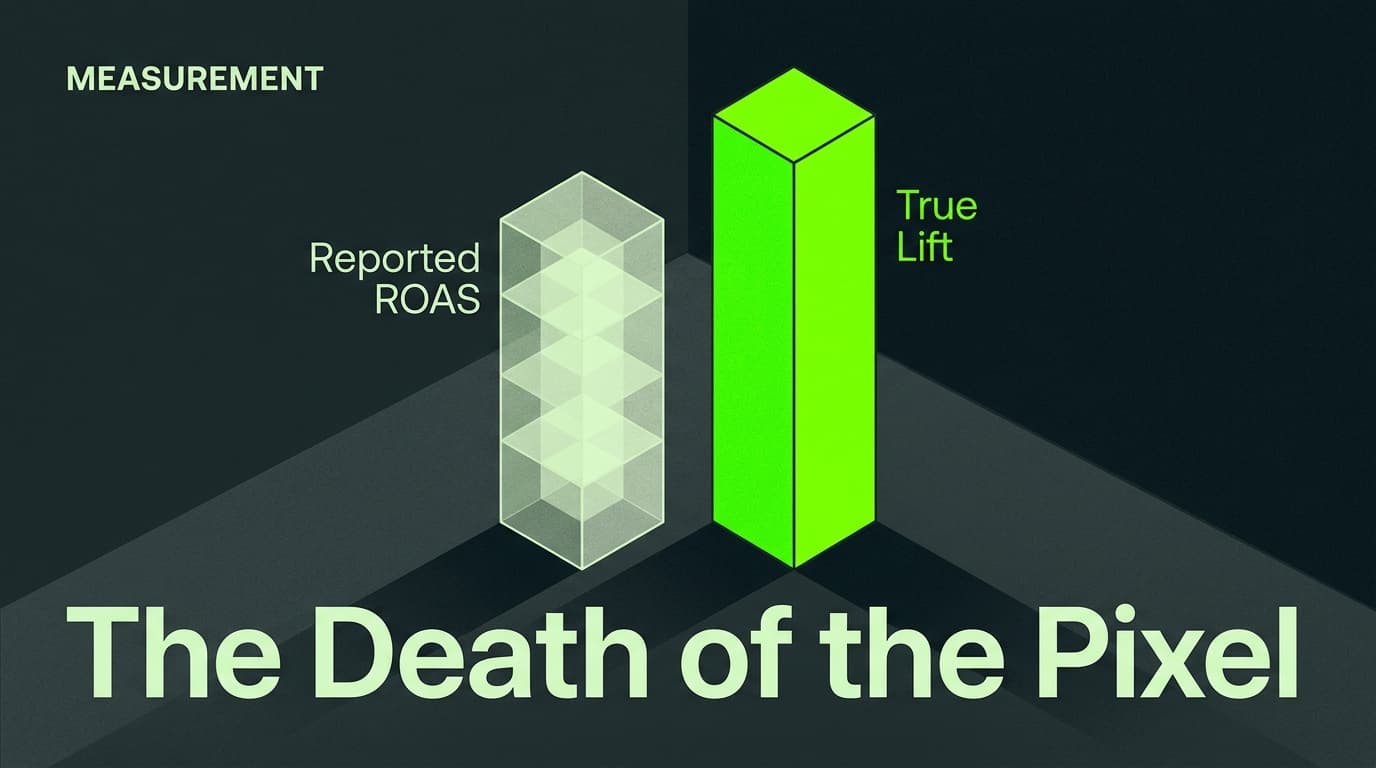
By the end of this guide, you will have a functional, statistically sound framework for determining exactly how many dollars your social ads are contributing to the bottom line—independent of the self-reported credit claimed by platform pixels. You'll move beyond the vanity of ROAS and into the reality of POAS (Profit Over Ad Spend).
Before you begin, ensure you have:
- A minimum monthly spend of $20,000 on a single platform (to ensure statistical significance).
- Access to your brand's raw transaction data (Shopify, Stripe, or internal CRM).
- Administrative access to Meta Events Manager or TikTok Events Manager.
- A baseline understanding of GA4's new 'Missing Identifier' diagnostics.
TL;DR
- The Problem: GA4 diagnostics now frequently flag missing identifiers, leading to a 30-40% underreporting of social touchpoints.
- The Fix: Incrementality testing (Intent-to-Treat) isolates the 'lift' by comparing a test group to a randomized holdout group.
- Key Metric: Focus on Cost Per Incremental Conversion (CPIC) rather than platform-reported CPA.
Step 1: Audit GA4 Diagnostics for Identifier Gaps
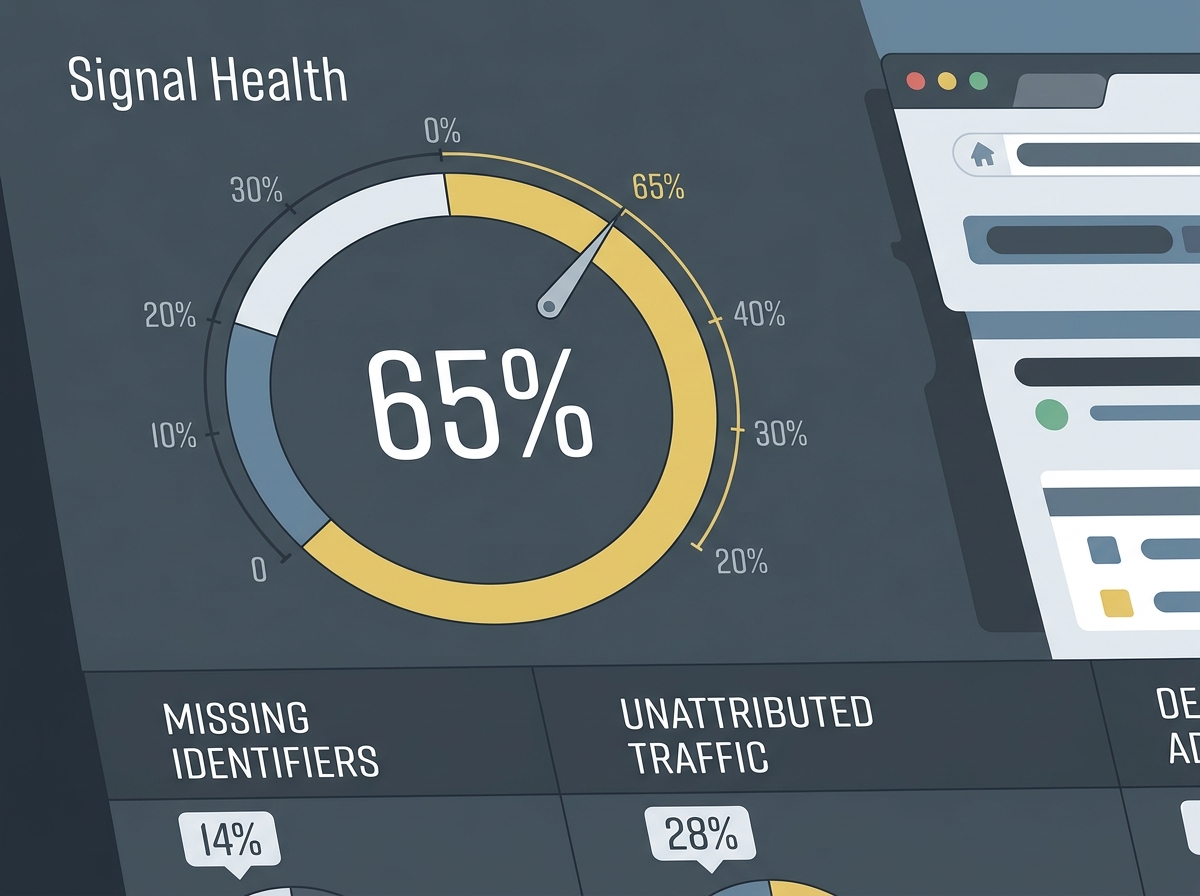
You cannot fix what you haven't quantified. Since the July 2026 updates to Google Analytics 4, the 'Campaign Diagnostics' panel has become the primary tool for identifying signal loss. If you see high percentages of 'Unattributed' traffic despite heavy social spend, your identifiers (like fbclid or ttclid) are being stripped by browser privacy layers or VPNs.
Open your GA4 property, navigate to Advertising > Campaign Diagnostics. Look for the 'Signal Health' score. If your score is below 70%, your standard attribution models—even Data-Driven Attribution (DDA)—are likely hallucinating or over-crediting Direct traffic at the expense of social. This gap is the primary reason why you need an incrementality test; you're trying to find the revenue that GA4 literally cannot see.
Common Pitfall: Many marketers assume that 'Enhanced Conversions' solve this. They don't. Enhanced Conversions help with matching known users, but they don't account for the 'halo effect' where a user sees an ad, doesn't click, but searches for the brand three days later. Incrementality captures this; GA4 doesn't.
Step 2: Define Your Randomized Control Trial (RCT) Parameters
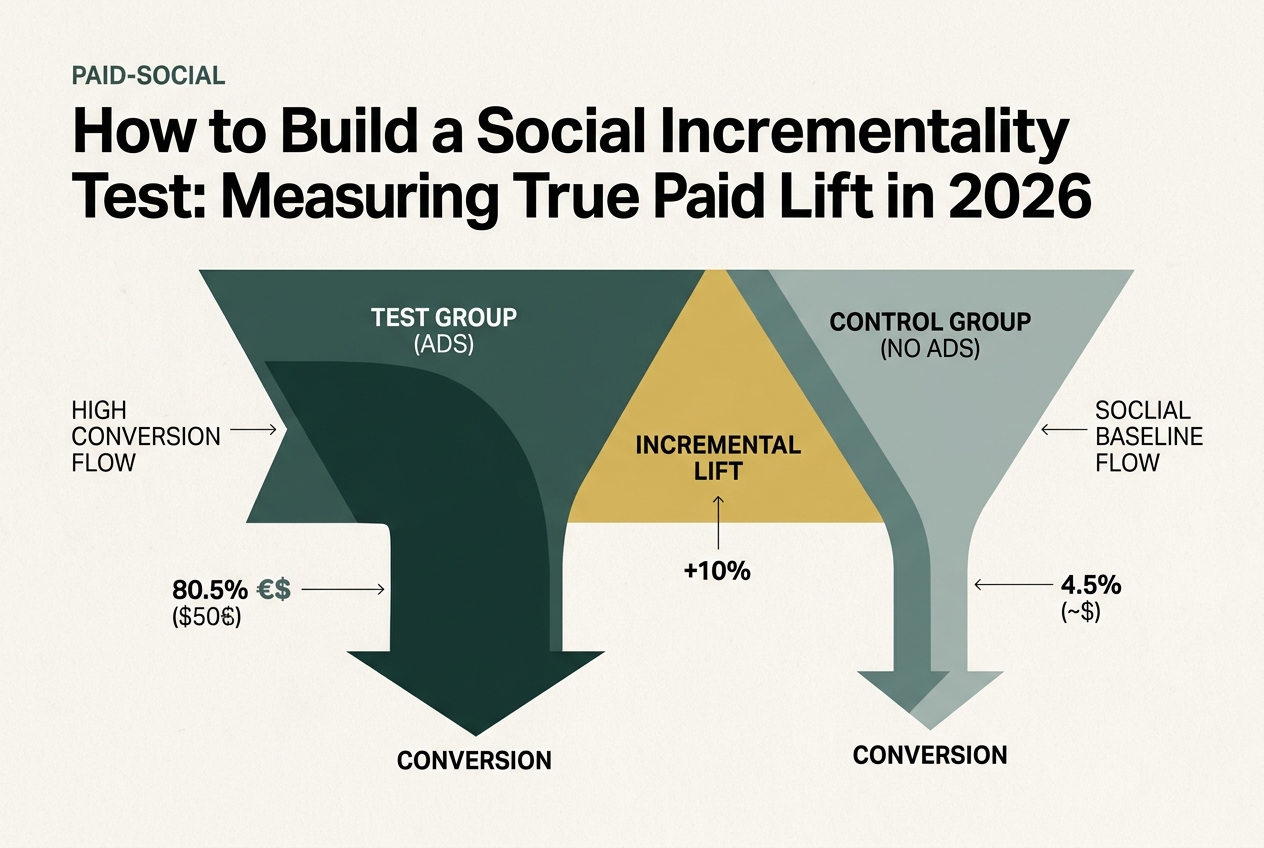
To measure true lift, you must split your audience into two groups: the Test Group (exposed to ads) and the Control Group (held out from ads). In 2026, the 'Intent-to-Treat' (ITT) model is the gold standard. You aren't just measuring people who clicked; you're measuring the behavior of the entire population you intended to reach.
On Meta, this is done via the 'Experiments' tool. On TikTok, it's 'Conversion Lift Study' (CLS). You must set your 'Holdout' percentage. For most brands, a 10% holdout is sufficient. This means 10% of your target audience will never see your ads during the test period.
Why does this matter? If the 10% who saw no ads still bought your product at a high rate, your ads aren't 'incremental'—they're just reaching people who were going to buy anyway. This is the 'Shark Week' effect: just as Discovery Channel sees a massive ratings spike in July 2026 due to cultural momentum [S1], your brand might have baseline demand that you're mistakenly attributing to paid spend.
Common Pitfall: Running a test for too short a window. You need at least two full conversion cycles. If your average time-to-purchase is 7 days, your test must run for at least 14 days to account for delayed attribution.
Step 3: Implement the 'Ghost Ad' or Public Service Announcement (PSA) Method
If you are not using the platform's built-in lift tools—perhaps because you are running a cross-channel test using a tool like Measured or Haus—you may need to use 'Ghost Ads'. This involves serving a generic, non-branded ad (like a PSA or a blank tile) to your control group to track their behavior without influencing their purchase intent.
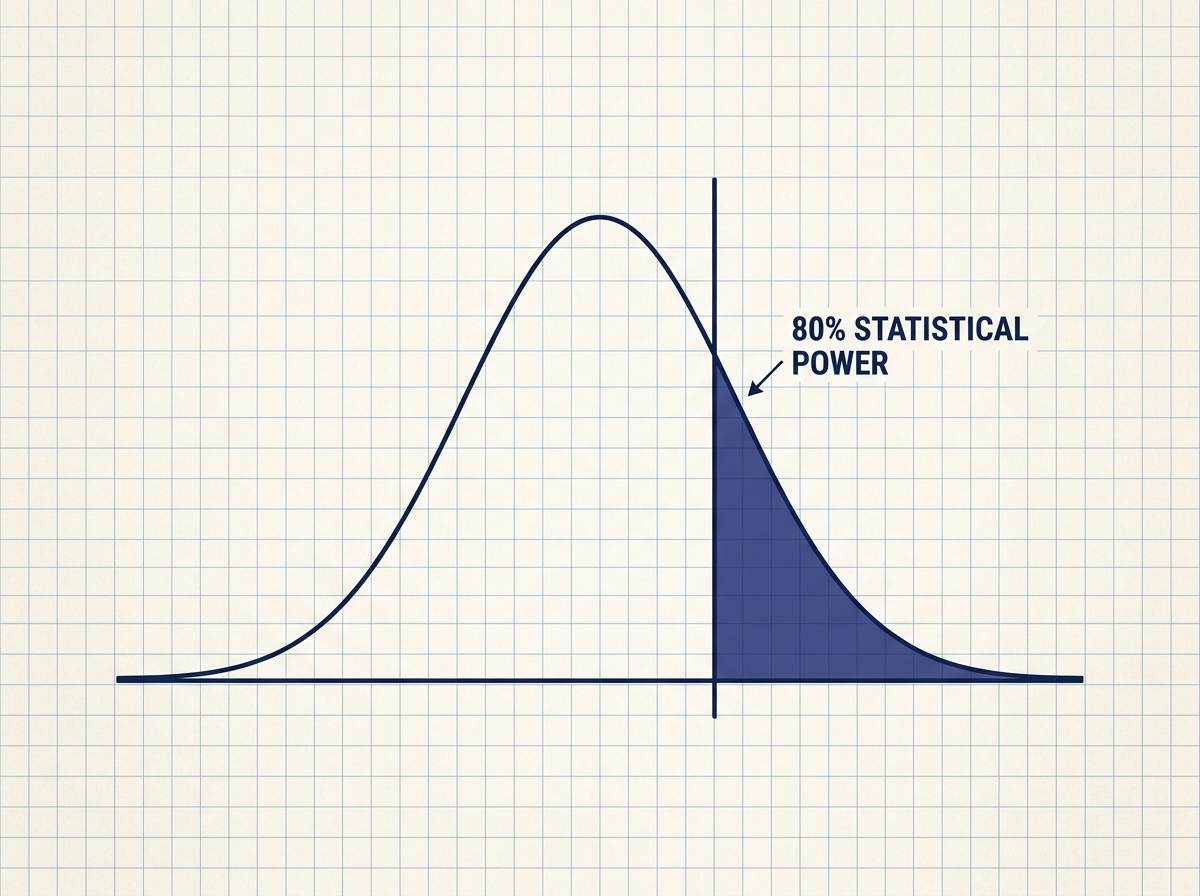
However, in 2026, the built-in 'Conversion Lift' tools on Meta and TikTok have become sophisticated enough that Ghost Ads are rarely necessary for single-platform tests. The platforms now use 'Synthetic Control Groups' which model the behavior of the holdout group with high precision. Ensure your 'Test Power' is at least 80% before launching. If the platform warns of 'Low Power,' you either need to increase your budget or extend the test duration.
Common Pitfall: Changing your creative or budget mid-test. This 'pollutes' the data. Treat the test period as a laboratory—no touches until the timer hits zero.
Step 4: Calculate the 'Incremental' Lift and POAS
Once the test concludes, ignore the ROAS column in Ads Manager. Instead, look at the 'Lift' percentage. The formula for Incremental Conversions is:
Incremental Conversions = (Conversions in Test Group) - (Conversions in Control Group * (Test Group Size / Control Group Size))
From here, calculate your Cost Per Incremental Conversion (CPIC):
CPIC = Total Spend / Incremental Conversions
If your platform-reported CPA is $20, but your CPIC is $60, you are paying 3x more for 'new' customers than the dashboard suggests. This is where you calculate POAS (Profit Over Ad Spend). Take the total margin from those incremental sales and divide it by the spend. If the ratio is above 1.0, you are generating real profit. If it's below 1.0, you are essentially subsidizing sales that would have happened anyway.
Step 5: Verification and Cross-Platform Calibration
How do you know if the results are real? You verify by looking at your 'Total Business Baseline'. During the test, did your total Shopify revenue increase by the amount the lift study claimed? If the lift study says you generated $50,000 in incremental revenue, but your total store revenue only grew by $10,000 compared to the previous period, the platform is likely over-counting its influence.
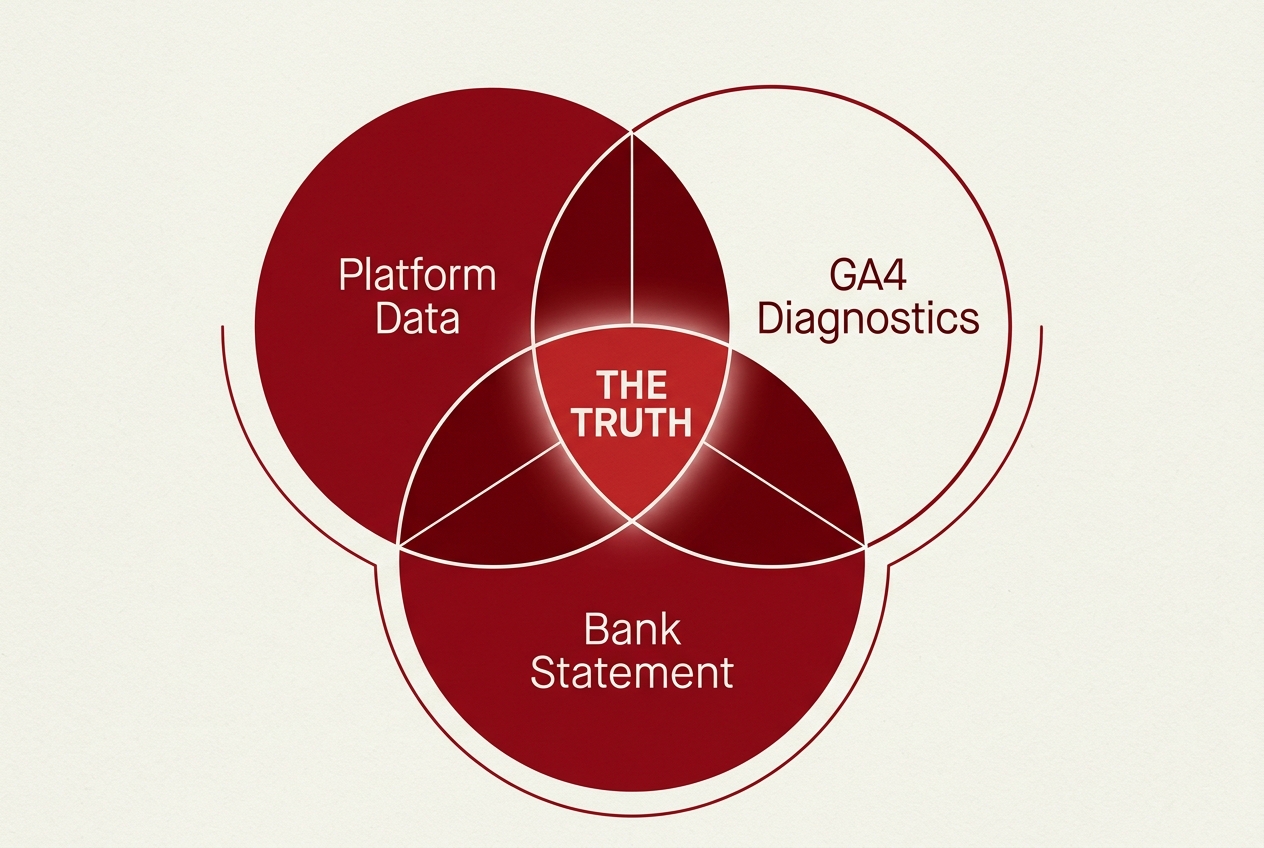
This is particularly relevant in a competitive landscape where holding companies are doubling down on new business teams to solve these exact measurement puzzles [S5]. You are looking for 'convergence'—where your lift study, your GA4 diagnostics, and your bank account all tell a similar story.
Common Pitfall: Ignoring the 'Negative Lift' possibility. Sometimes, ads can actually decrease total profit if they are cannibalizing high-margin organic sales or driving low-quality traffic that bounces. Don't be afraid to cut spend if the incrementality is zero.
Next Steps: 3 Related Tactics to Refine Your Measurement
- Geo-Match Testing: Instead of user-level holdouts, turn off ads in specific geographic regions (e.g., Ohio vs. Michigan) and compare the total revenue delta between the two. This bypasses all tracking pixels and relies on pure 'clean room' data.
- Post-Purchase Surveys (PPS): Use a tool like Fairing or KnoCommerce to ask every customer: 'How did you first hear about us?' Compare the survey results to your lift study. If 40% say 'TikTok' but TikTok only claims 10% lift, you have a massive 'dark social' opportunity.
- Media Mix Modeling (MMM): As you scale, move toward open-source MMM tools like Meta's Robyn or Google's LightweightMMM. These use historical spend and revenue data to calculate the 'diminishing returns' curve for every channel, helping you decide where the next dollar should go.
By moving to an incrementality-first mindset, you stop being a buyer of 'clicks' and start being a buyer of 'growth'. In an era where identifiers are disappearing, the only truth left is the lift.
FAQ