
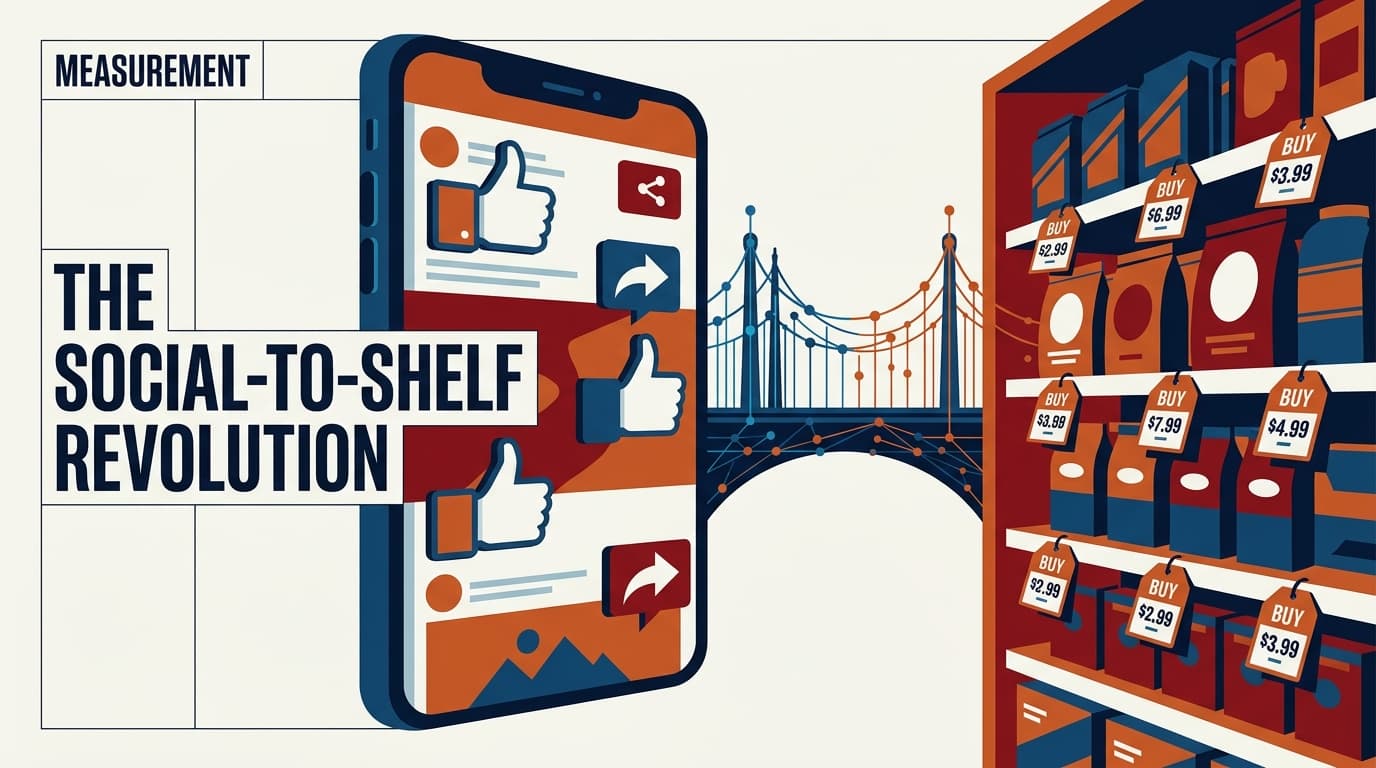
The dream of closed-loop measurement has long been deferred by the 'walled garden' problem. You run a high-impact campaign on TikTok or Meta, and while your engagement metrics look stellar, your retail sales at Dick’s Sporting Goods or Walmart remain a black box. You know the ads are working, but proving a direct line from a thumb-stop to a checkout at a physical POS has required more guesswork than math. That changed when Adobe and Dick’s Sporting Goods recently began piloting integrated creative models that allow for granular, SKU-level tracking across retail media networks (RMNs).
By the end of this guide, you will have a blueprint for building a 'social-to-shelf' attribution model. This isn't just about tracking clicks; it's about matching anonymized user identities from social platforms to verified transaction data via LiveRamp. To get started, you'll need access to your brand's Meta Business Manager or TikTok For Business account, a LiveRamp Abacus/RampID seat, and a partnership agreement with at least one RMN that provides daily transaction feeds.
TL;DR
- The Shift: Retail Media Networks are moving from simple on-site banners to full-funnel social integration.
- The Tech: LiveRamp acts as the identity bridge, using RampIDs to connect social ad exposure to retail loyalty card data.
- The Result: You can finally calculate a true ROAS based on offline SKU-level sales rather than modeled digital proxies.
Step 1: Configure Your Identity Bridge with LiveRamp
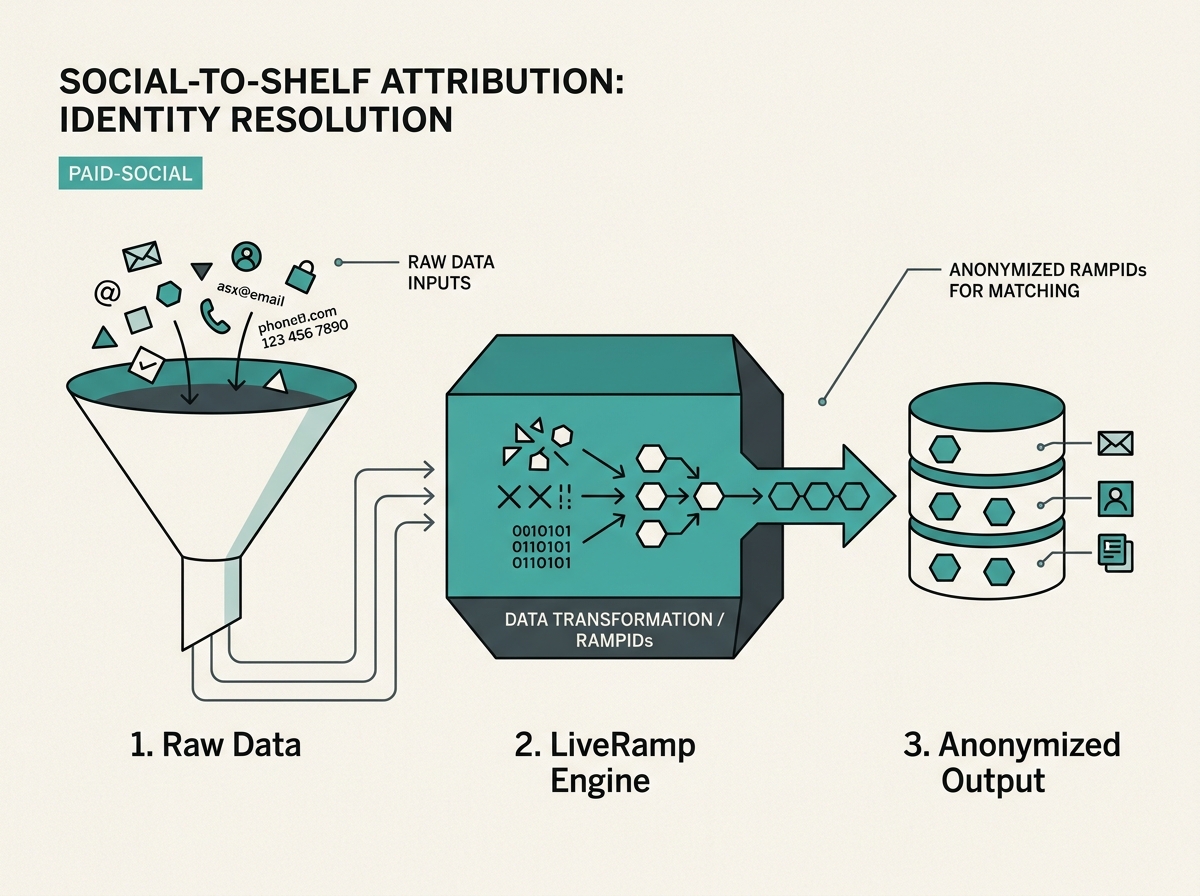
Before you can measure anything, you need a common language. Social platforms use their own internal IDs, and retailers use loyalty card numbers or hashed emails. LiveRamp’s RampID serves as the Rosetta Stone. You must first ensure your first-party data (CRM) and your retailer’s transaction data are both 'RampID-enabled.'
Why it matters: Without a persistent, privacy-safe identifier, you are stuck with last-click attribution, which fails to capture the 90% of retail sales that still happen offline. By using a neutral third-party identity resolution service, you circumvent the data-sharing restrictions that usually prevent Meta from seeing what happens inside a physical store.
To execute this, you need to upload your customer segments into the LiveRamp Safe Haven or a similar Data Clean Room (DCR). The system will append a RampID to each record. When the retailer uploads their transaction logs, those too are assigned RampIDs.
Common Pitfall: Don't assume all email hashes are created equal. If your retailer uses SHA-256 and you use MD5, the match rate will plummet. Standardize your hashing protocols before the first upload to ensure a match rate of at least 40-60%, which is the industry benchmark for healthy RMN integrations.
Step 2: Establish the Social-to-RMN Data Clean Room
The second step is where the 'social' meets the 'shelf.' You must set up a collaborative environment—a Data Clean Room—where the social platform’s exposure data and the retailer’s sales data can be joined without either party seeing the other's PII (Personally Identifiable Information). Platforms like Snowflake or Amazon Marketing Cloud (AMC) are the standard here, though Meta’s Advanced Analytics (MAA) is increasingly the go-to for Facebook and Instagram-specific loops.
You will request a 'Daily Exposure Feed' from your social partners. This feed contains a list of every user (anonymized via RampID) who saw or clicked your ad. Simultaneously, the retailer pushes a 'Daily Transaction Feed' containing SKU-level data, timestamps, and the associated RampID.
Why it matters: This allows you to perform 'Path to Purchase' analysis. You can see that a user saw a Reels ad on Monday, a TikTok Spark Ad on Wednesday, and bought the specific SKU at a Dick’s Sporting Goods location on Friday. This level of granularity is what separates a staff journalist's analysis from a basic press release summary.
Common Pitfall: Many marketers forget to include 'Control Groups.' To prove incrementality, you must withhold the ad from a small percentage of your target audience within the clean room. If the 'unexposed' group buys the product at the same rate as the 'exposed' group, your social spend isn't actually driving new revenue—it's just claiming credit for existing demand.
Step 3: Mapping SKU-Level Data to Creative Variations
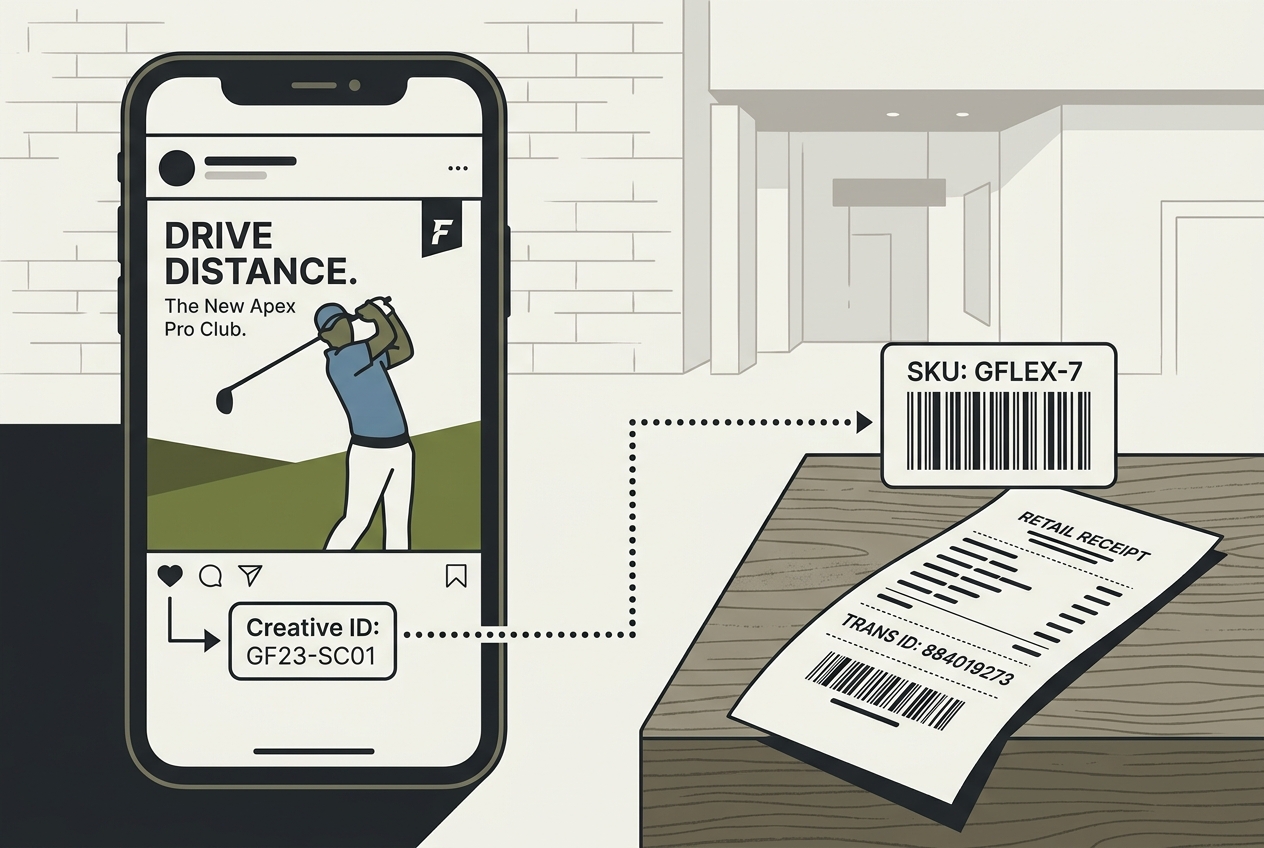
Now that the data is joined, you need to categorize it. This is where the creative models pioneered by companies like Adobe come into play. You shouldn't just track 'Total Sales'; you should track 'Sales by Creative Asset.'
Use UTM parameters and specific ad naming conventions that include the SKU or Product Category. For example, if you are running a campaign for the new TaylorMade Qi10 driver, your ad naming convention should look like: Social_Retailer_TaylorMade_Qi10_Video_CreatorName.
Why it matters: In a recent case study, a golf shop saw massive success with TikTok comedy videos TikTok retail success stories. However, without SKU mapping, they couldn't tell if the comedy videos sold drivers or just cheap golf balls. By mapping the creative to the specific transaction, you can optimize your creative spend toward high-margin items.
Common Pitfall: Over-attribution to high-frequency users. Your most loyal customers will likely see your ads and buy your products regardless of the ad. Use 'New-to-Brand' (NTB) metrics within your RMN dashboard to filter out existing loyalty members and see who your social ads actually converted for the first time.
Step 4: Normalizing Attribution Windows for Retail Realities
Standard social attribution windows (like Meta’s 7-day click / 1-day view) are often too short for retail. A consumer might see an ad for a $600 treadmill on social media but not visit a physical store to buy it until the following weekend.
In your model, you should test a 14-day or 30-day attribution window for high-consideration items. For CPG (Consumer Packaged Goods) like snacks or beverages, a 3-7 day window is more appropriate. You must align these windows between your social platform and your retail media network to ensure you aren't double-counting.
Why it matters: If you stick to a 1-day view window, you will drastically under-report the value of your social spend. Retail media is a long-tail game. According to recent benchmarks from agencies like Skai, extending the window to 14 days for durable goods can increase reported ROAS by up to 35% without inflating the data.
Common Pitfall: Ignoring 'Halo Effects.' If a user sees an ad for a specific pair of Nike shoes but buys a Nike shirt instead, many models count this as a failure. A sophisticated social-to-shelf model should track 'Brand Halo' sales to capture the full value of the ad exposure.
Step 5: Verification and Calibration
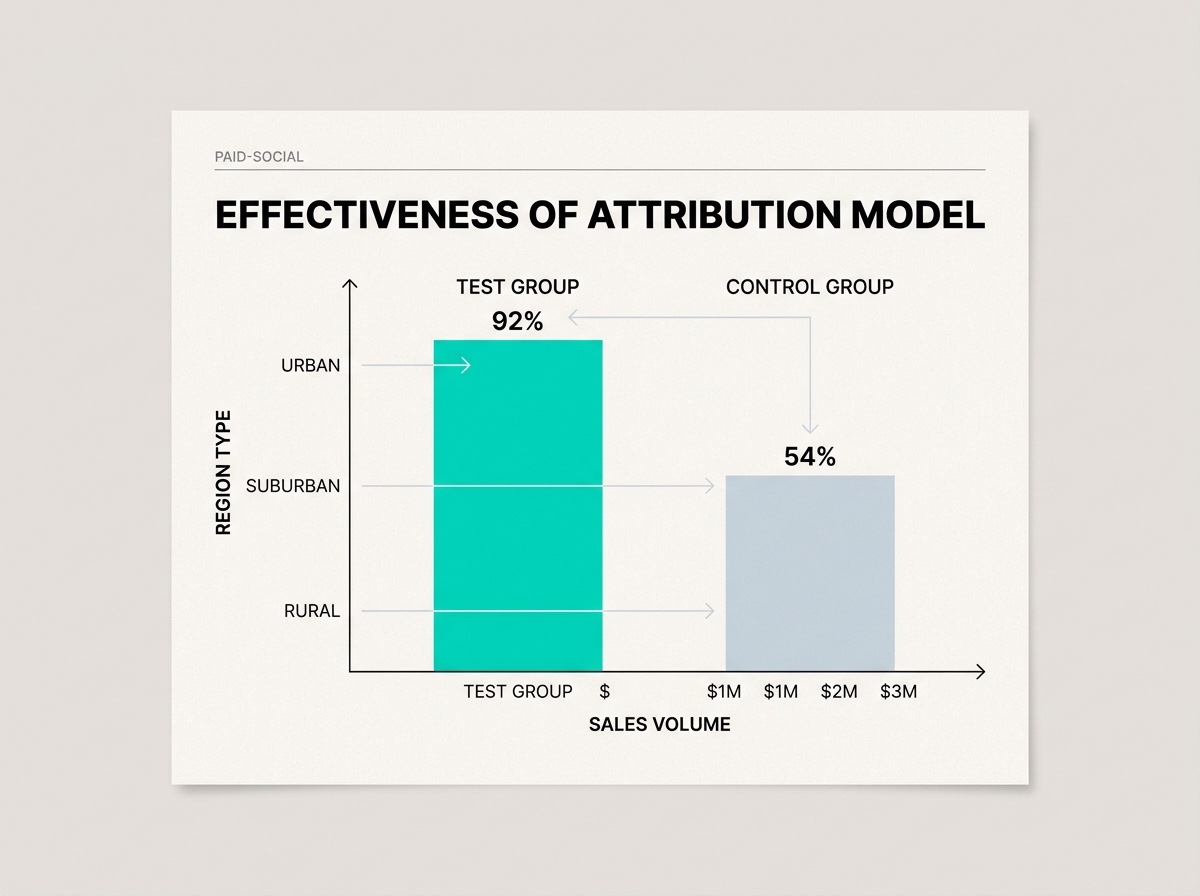
How do you know your model is accurate? You conduct a 'Lift Study.' This is the final verification step. Work with your RMN partner to run a synchronized test where one geographic region receives the social ads and a matched 'twin' region does not.
Compare the total sales lift in the 'Test' region (verified via LiveRamp) against the 'Control' region. If your attribution model says you generated $100k in sales, but the regional lift study only shows a $20k delta between the two regions, your model is likely over-attributing due to organic brand strength or other marketing channels like Search.
Why it matters: Verification protects your budget. It prevents you from pouring money into 'last-touch' social ads that are simply poaching sales that Google Search or email marketing would have captured anyway.
Common Pitfall: Failing to account for seasonality. Don't run your verification study during Black Friday or a major holiday. The 'noise' of general retail traffic will drown out the 'signal' of your social-to-shelf model. Choose a 'neutral' period in the retail calendar for your first calibration.
Three Related Tactics to Try Next
Once your basic closed-loop model is running, you can move into more advanced territory:
- Dynamic Creative Optimization (DCO) based on Local Inventory: Use your RMN's inventory feed to automatically pause social ads for products that are out of stock in specific zip codes. There is no faster way to kill ROAS than paying for clicks on a product the customer can't find on the shelf.
- Influencer-to-POS Mapping: Assign unique 'Retailer Codes' or RampID-tracked links to your influencers. This allows you to see which creators are driving actual foot traffic and SKU sales, rather than just 'likes' and 'saves.'
- Predictive Re-stocking Ads: Use transaction data to identify the average 'replenishment cycle' for your product (e.g., customers buy a new bottle of protein powder every 45 days). Trigger social ads to those specific RampIDs on day 40 to ensure your brand is top-of-mind for their next retail trip.
The collapse of the silo between social and retail isn't just a technical upgrade; it's a fundamental shift in how we value social media. It moves social from the 'experimental' or 'brand awareness' bucket directly into the 'performance' bucket. If you can prove your TikTok ad sold a specific pair of cleats at a specific Dick's Sporting Goods on a Tuesday afternoon, you no longer have to fight for your budget—the data does the fighting for you.
FAQ