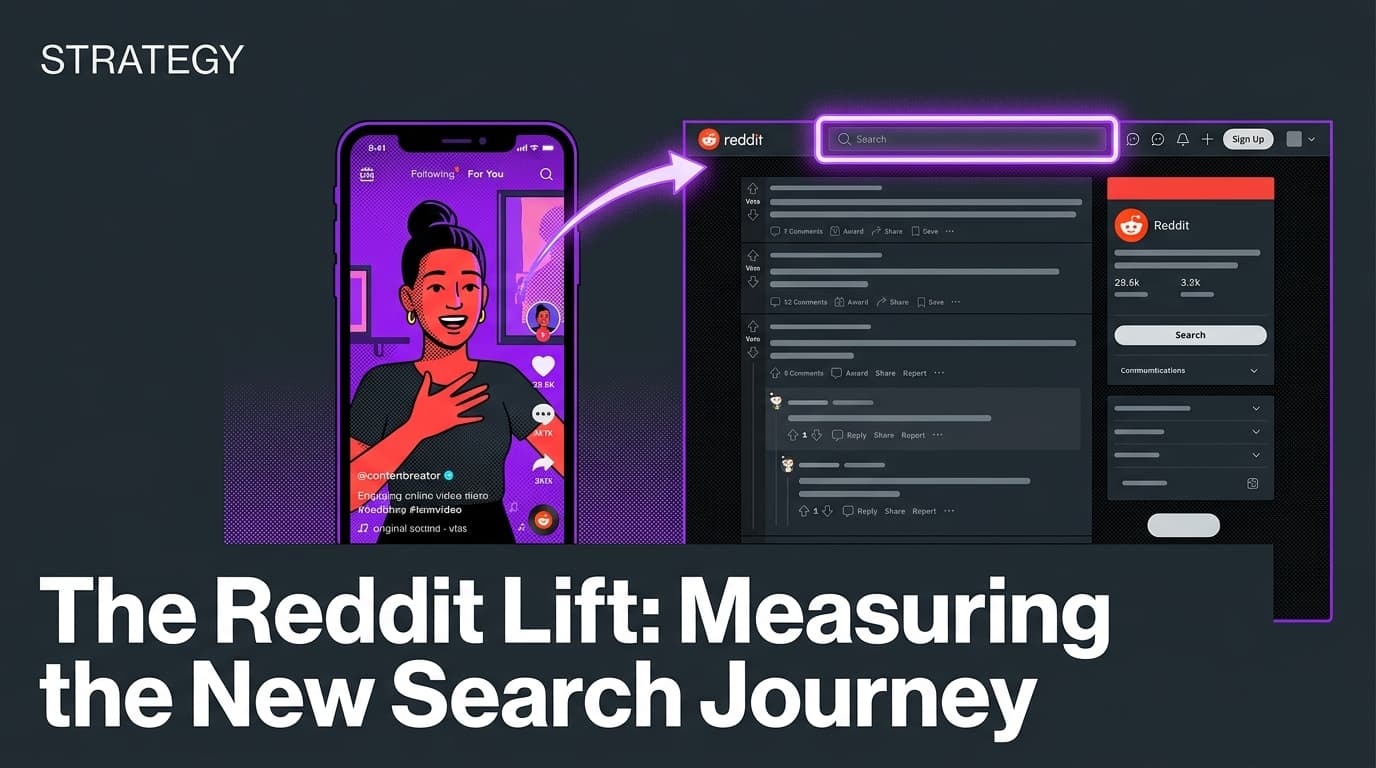


Last-click attribution is a comfort blanket that no longer keeps you warm. For years, social media managers relied on the Meta Pixel or the TikTok Pixel to tell a linear story: user sees ad, user clicks ad, user buys product. But since the rollout of iOS 14.5 and the ongoing deprecation of third-party cookies, that story has more holes than a screen door. If you're still judging your social spend solely on what shows up in Google Analytics 4 (GA4), you aren't just undercounting—you're likely misallocating millions in budget.
Why it matters: Proving the true value of social spend now requires shifting from 'tracking' to 'testing.' By using geo-holdout experiments and brand lift studies, you can isolate the specific revenue that would not have happened without your social ads. This is the only way to defend your budget in a boardroom that increasingly demands Marketing Mix Modeling (MMM) levels of rigor.
TL;DR
- Move beyond pixels: Third-party cookies are dead; incrementality testing is the only way to measure latent demand.
- Geo-holdouts are king: Use geographical cell testing to compare sales in 'on' vs. 'off' regions to find your true lift.
- Platform tools have limits: Native brand lift studies on Meta and TikTok are useful but often biased; third-party validation is necessary for high-spend accounts.
- Focus on search lift: Measure how social spend drives branded search volume in Google Trends and Search Console.
The Death of the Pixel and the Rise of Incrementality
We've entered an era where 'attribution' is a dirty word. When you look at your dashboard and see a 4.0x ROAS, what are you actually seeing? In many cases, you're seeing credit-taking, not value-creation. Platforms are incentivized to claim credit for every user who grazed an ad before purchasing. However, as privacy regulations tighten and signal loss increases, the gap between 'platform reported' and 'actual business impact' has widened into a canyon.
This is where social media incrementality comes in. Incrementality is the measure of the lift that advertising provides above the 'baseline'—the sales that would have happened anyway. If a loyal customer was going to buy your product regardless of seeing an Instagram story, that ad spend had zero incrementality. Conversely, if a Gen Z shopper discovers a brand like Jazzercise through a TikTok campaign and signs up for a class they didn't know existed, that's 100% incremental. Per Adweek's coverage in August 2026, Jazzercise is currently using precisely this type of targeted awareness to bridge the gap between its legacy base and new demographics [S1].
To measure this, you need a Brand Lift Study (BLS). But the traditional BLS—which relies on polling users—is only half the battle. To get the full picture, you need to combine survey-based sentiment with conversion-based holdouts. This tutorial focuses on the latter: the 'Social-Only' geo-test.
Setting Up the Geo-Holdout: The Purest Test of Lift
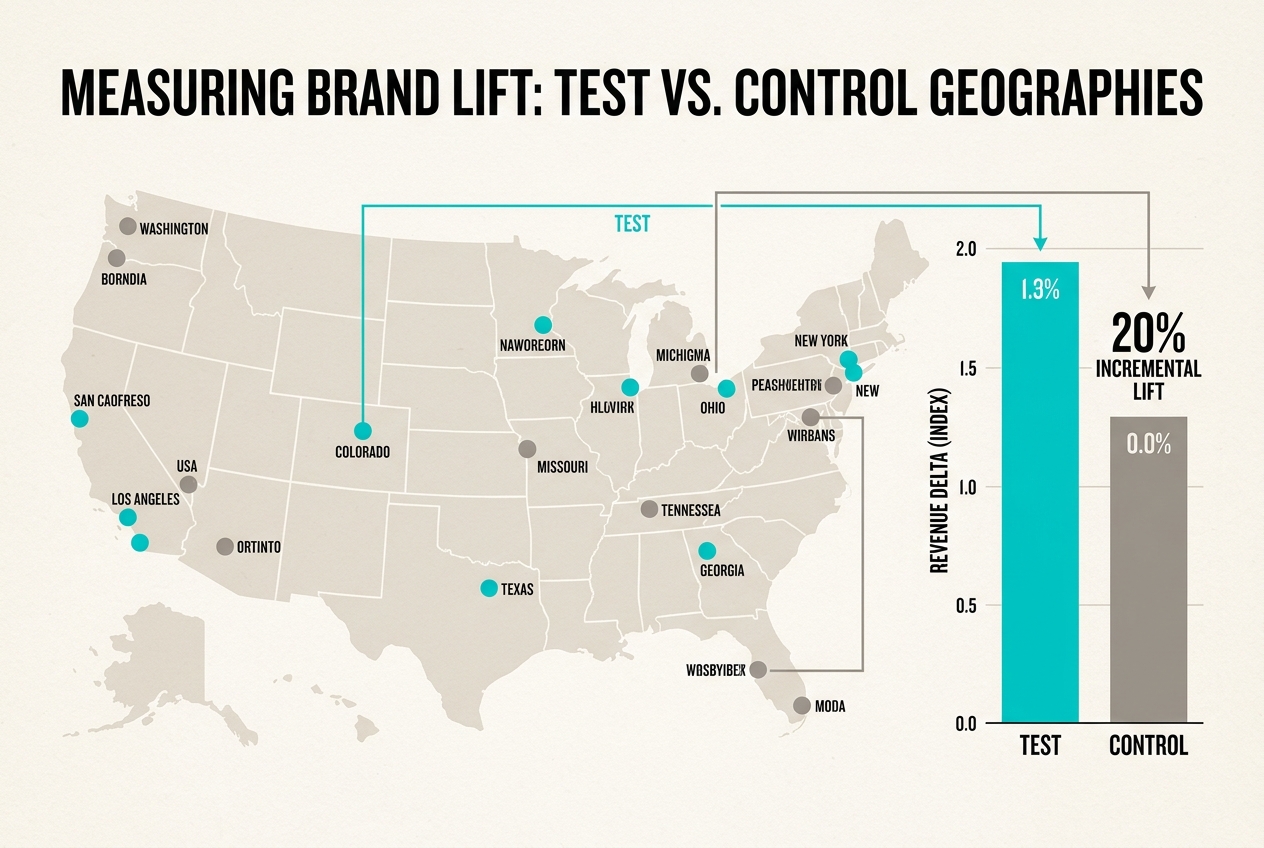
A geo-holdout test is the gold standard for post-cookie attribution. Instead of trying to track individual users, you divide your target market into two geographical groups: the 'Test' group (where ads are running) and the 'Control' group (where ads are paused).
Step 1: Selecting Your Markets
You cannot simply pick New York as your test and Los Angeles as your control. They are too different. Instead, you must use a 'Matched Market' approach. Look for cities or regions with similar baseline sales trends, population density, and demographic profiles.
For example, if you are a mid-sized e-commerce brand, you might pair Charlotte, NC with Indianapolis, IN. Use at least 10-15% of your total market as the holdout (Control) to ensure statistical significance. If your control group is too small, the 'noise' in the data will drown out the signal of your ad impact.
Step 2: The Blackout Period
Before you start the test, establish a 14-day baseline. During this time, spend should be consistent across all regions. Then, 'darken' the control regions. Stop all social spend in those specific zip codes or DMAs (Designated Market Areas). Keep your spend in the test regions exactly the same or scale it up to see the delta.
Step 3: Measuring the Delta
After 30 days, compare the total revenue from the test regions vs. the control regions.
The Formula: Incrementality % = ((Test Revenue / Control Revenue) - 1) * 100
If your test regions saw $120,000 in sales and your control regions (scaled to the same population size) saw $100,000, your social spend drove a 20% incremental lift. This is data that doesn't rely on a single cookie or IDFA signal.
Platform-Specific Implementation: TikTok vs. Meta
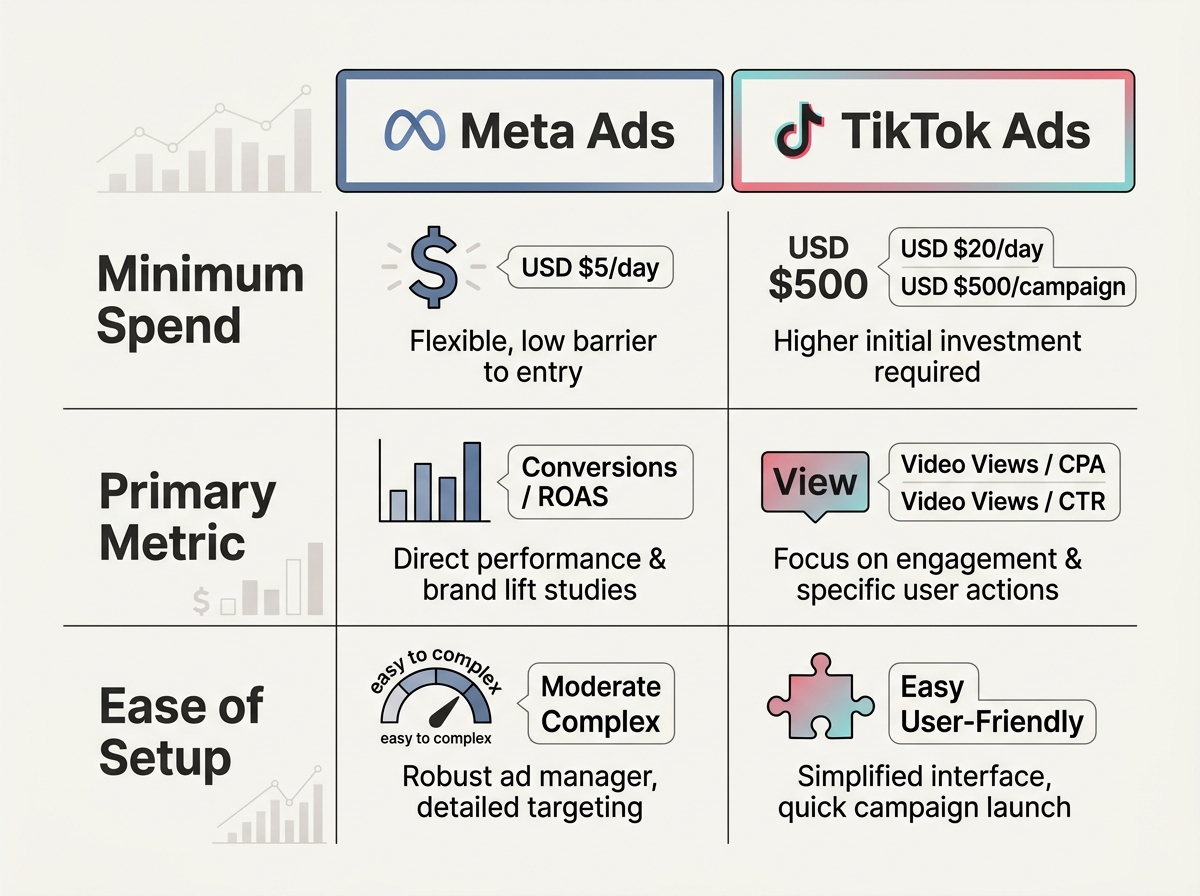
While the theory of geo-testing is platform-agnostic, the execution varies wildly between the big players. Both Meta and TikTok have built-in tools to help, but they often come with high spend thresholds.
Meta's Brand Lift and Conversion Lift Tools
Meta’s 'Experiments' tab is the most mature in the industry. It allows you to run 'Multi-Cell' tests where you compare different creative strategies against a holdout.
- The Catch: Meta usually requires a minimum spend of $30,000 to $50,000 over a 30-day period to guarantee enough 'Power' (the statistical likelihood of detecting an effect).
- The Strategy: Use Meta’s 'Conversion Lift' tool specifically for 'View-Through' conversions. Since the iOS 14 update, Meta has struggled to track users who see an ad on Instagram but buy on a desktop later. A Conversion Lift study uses Meta’s internal ID graph to match those users back without needing third-party cookies.
TikTok’s Brand Lift Study (BLS)
TikTok is the king of top-of-funnel awareness, but its attribution is notoriously difficult. As noted by Influencer Marketing Hub in July 2026, TikTok campaigns often drive 'halo effects' that show up in organic search rather than direct clicks [S2]. To run a BLS on TikTok:
- Work with a rep: Unlike Meta, TikTok’s most robust lift studies often require manual setup by an account team.
- Poll-based lift: TikTok will serve a one-question survey (e.g., "Have you heard of [Brand]?") to a group that saw your ad and a group that didn't.
- The 'Search Lift' signal: Monitor your branded search volume in Google Ads during the TikTok flight. If your TikTok spend increases by 50% and your 'Brand Name' search volume in Google increases by 20%, you've found your incrementality.
Advanced Tactics: Measuring the 'Search Halo'
One of the biggest mistakes marketers make is looking at social in a vacuum. Social media is the greatest driver of 'Intentional Search.' A user sees a Reel about a new fitness tracker, doesn't click, but goes to Google three hours later and searches for that specific brand name.
In a post-cookie world, you must treat 'Branded Search' as a social media conversion metric.
Using Google Trends for Incrementality
When running a geo-holdout on social, track the Google Trends interest for your brand in the specific DMAs you are targeting. If the 'Test' cities show a 40% higher search interest than the 'Control' cities, you can confidently attribute that search volume—and the resulting high-intent sales—to your social creative.
This is particularly vital as platforms like Instagram continue to tweak their algorithms. According to recent insights from The Mandy Network, Instagram’s 2026 algorithm updates prioritize 'Originality' and 'Saves' over clicks [S5]. This means more users are consuming content and acting later, rather than clicking immediately. If you aren't measuring the search lift, you're missing the most valuable part of the funnel.
Troubleshooting Common Measurement Pitfalls
Even the best-designed lift study can be derailed by external factors. Here is how to keep your data clean:
1. The 'Contamination' Problem
If you are running a heavy TV campaign or a massive email blast at the same time as your social geo-test, your results will be skewed. To get a 'Social-Only' read, you must keep all other marketing variables constant across both test and control regions. If you send an email to your entire list, ensure the distribution of that list is equal across your geo-cells.
2. Seasonality and External Events
Don't run an incrementality test during Black Friday or a major holiday unless you are specifically testing holiday lift. The baseline 'noise' is too high. Similarly, watch out for local events. Running a test in Florida during a hurricane will yield useless data.
3. The 'Zero-Result' Trap
Sometimes, a lift study will return 'Neutral' or 'Inconclusive' results. This doesn't mean your ads aren't working; it often means your sample size was too small or your creative wasn't distinct enough to drive a measurable change in behavior. If this happens, don't give up. Increase your spend in the test cells and try again with a more aggressive 'Call to Value' (CTV) rather than a 'Call to Action' (CTA).
The Role of AI and Authenticity in Modern Lift
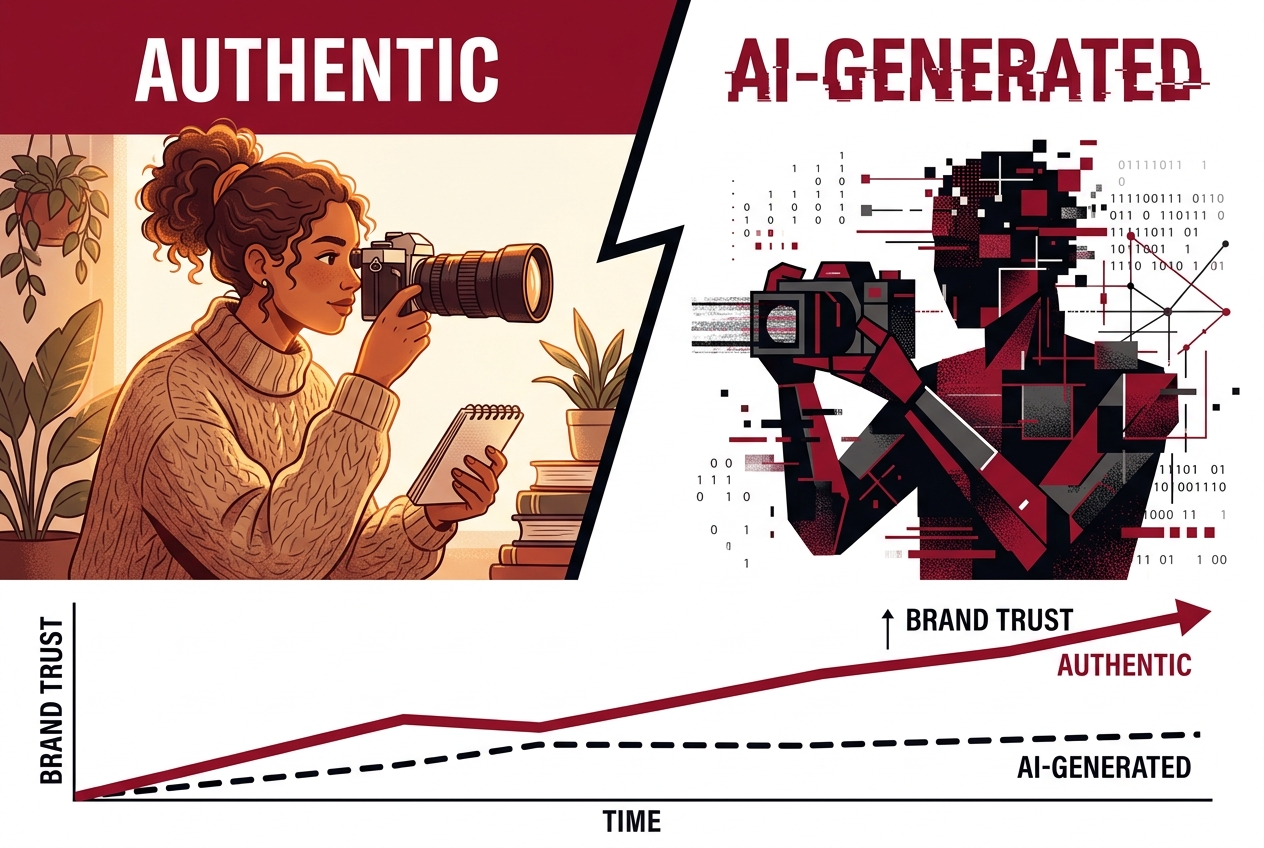
As we look toward 2027, the nature of the 'creative' being tested is shifting. Snapchat recently announced it is removing wholly AI-generated videos from its 'Spotlight' recommendations to favor authentic, human-authored experiences [S3]. This has a massive implication for your lift studies.
If you are testing AI-generated creative vs. creator-led content, you may find that while AI creative is cheaper to produce, its incrementality is lower because users have developed 'AI blindness.' Authenticity—real people using real products—remains the highest-performing variable in driving brand lift. When setting up your multi-cell tests, always include a 'Human-Centric' cell as your benchmark.
Workflow: A 90-Day Incrementality Roadmap
To move your organization toward a testing-first mindset, follow this 90-day plan:
Days 1-30: The Baseline Audit
- Audit your current GA4 and platform reporting.
- Identify the 'Gap' (e.g., Meta says you made $1M, GA4 says you made $400k).
- Select your 10 matched-market pairs for geo-testing.
Days 31-60: The First Flight
- Launch your geo-holdout test on your primary platform (Meta or TikTok).
- Ensure all other variables (Search, Email, OOH) are held constant.
- Monitor branded search lift daily.
Days 61-90: Analysis and Scaling
- Calculate your 'Incrementality Multiplier.' If your lift is 1.5x what GA4 reports, your new 'True ROAS' is GA4 ROAS * 1.5.
- Present these findings to finance to unlock additional 'Experimental' budget.
- Rotate your geo-cells (make the old control regions the new test regions) to validate the findings.
Conclusion: From Tracking to Truth
Stop waiting for a technical solution to the cookie problem. There is no 'new pixel' coming to save the day. The future of social media marketing belongs to the strategists who embrace the scientific method. By running regular, disciplined brand lift studies and geo-holdouts, you stop guessing and start knowing. You move from being a 'spender' to being an 'investor' who can prove exactly how many dollars of revenue every social impression creates.
Start small. Pick two cities. Turn off the ads in one. See what happens. The truth is usually found in the dark.
FAQ