
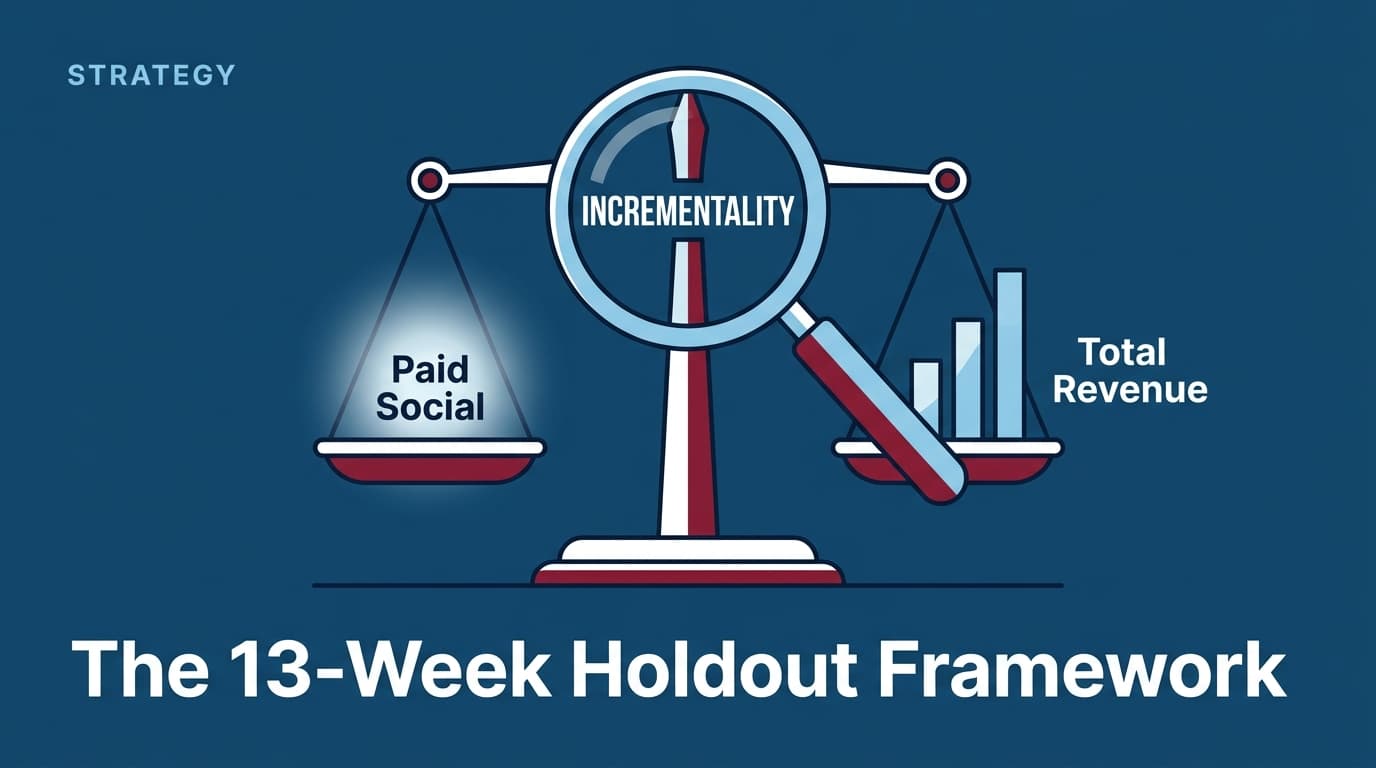
You are likely overestimating your paid social performance by 20% to 40%. It isn't a failure of the pixel or a glitch in your UTMs; it is the fundamental reality of brand overlap. A recent 13-week search test highlighted by Search Engine Land in August 2026 revealed that significant 'paid' traffic was actually cannibalizing organic intent. If this is happening in high-intent search, the problem is magnified in the discovery-based environments of Meta and TikTok.
By the end of this guide, you will have a rigorous, 13-week framework to determine your true incremental ROAS (iROAS). You will move past the vanity of last-click or even multi-touch attribution (MTA) and start measuring the only thing that matters: how many sales would not have happened if you turned the ads off.
Key takeaways
- Cannibalization is real: Last-click attribution often credits ads for conversions that organic search or direct traffic would have captured anyway.
- 13 weeks is the gold standard: You need a full business quarter to account for varying conversion windows and the 'decay' effect of turning off ads.
- Holdout groups are essential: By isolating a control group that sees no ads, you create a scientific baseline for true performance.
- iROAS > ROAS: Success is measured by the delta between the test and control groups, not the number in your Ads Manager dashboard.
Step 1: Define your geographic or audience clusters
Before you flip a single switch, you must decide how you will split your audience. In a perfect world, Meta’s Conversion Lift tool handles this via a randomized control trial (RCT) at the user level. However, as privacy regulations tighten and signal loss increases, user-level tracking is becoming less reliable.
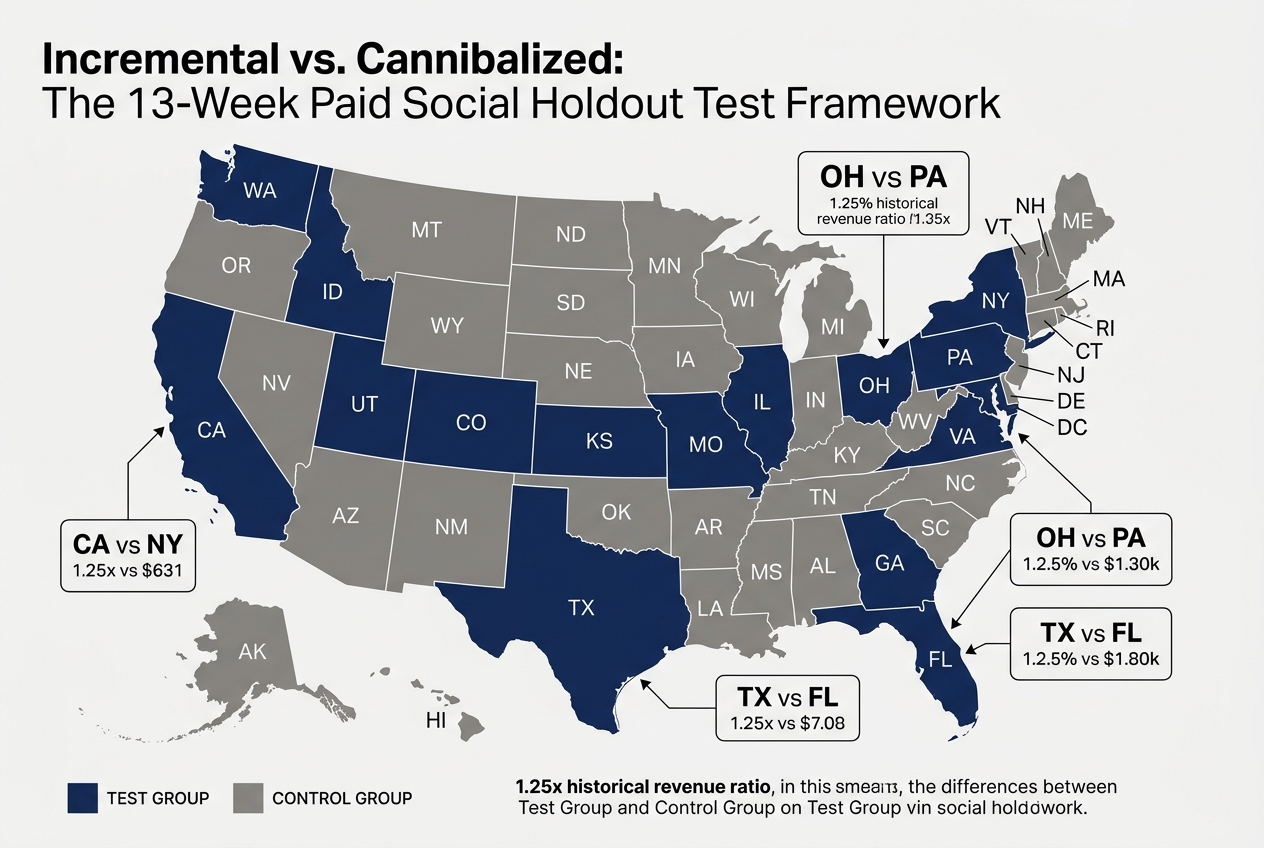
For a 13-week test, the most robust method is a Geographic Split. You divide your target markets into two groups: 'Test' (Ads remain on) and 'Control' (Ads are turned off). To do this correctly, you must pair regions with similar historical performance. If you are a US-based brand, you might pair Ohio with Pennsylvania or Oregon with Washington. You aren't looking for identical populations; you are looking for correlated sales trends.
Why it matters: If you simply turn off ads for the whole country, you have no baseline to compare against. You might see sales drop, but was it because of the ads or because of a seasonal slump? A split-test provides the counterfactual.
Common pitfall: Choosing a control group that is too small. If your control group represents less than 10-15% of your total revenue, the 'noise' in the data will drown out the signal. You need enough volume in the holdout group to reach statistical significance.
Step 2: Establish the 4-week baseline (Phase 1)
The 13-week framework is broken into three distinct phases. Phase 1 is the baseline. For the first four weeks, you do nothing different. You run your Meta and TikTok campaigns as usual, but you ensure your tracking—specifically your CAPI (Conversions API) and offline conversion sets—are perfectly aligned across all regions.
During this month, you are collecting the 'Normal State' data. You need to calculate the ratio of Paid Conversions to Organic/Direct conversions in both your intended Test and Control regions. For example, if Region A (Test) usually does $100k in total sales and Region B (Control) does $80k, that 1.25x ratio is your baseline.
Why it matters: You cannot measure lift if you don't know the natural variance between your groups. Even similar regions have different behaviors. This phase 'calibrates' your scale.
Common pitfall: Changing your creative strategy or budget during the baseline. Keep everything static. If you launch a massive influencer campaign or a 50% off sitewide sale during the baseline, you've polluted the well. Consistency is the prerequisite for science.
Step 3: Implement the 5-week 'Dark' period (Phase 2)
This is the hardest part for most marketing leads to stomach. In week 5, you completely cease all paid social activity in your Control regions. No Meta, no TikTok, no Pinterest—nothing. You continue your spend in the Test regions at the same levels as the baseline.
Why five weeks? The first week is often misleading. Users who saw an ad in week 4 might still convert in week 5 (the 'halo effect'). By week 8 or 9, that effect has largely faded. You are looking for the 'trough'—the point where sales in the Control region stabilize at a lower level.
How to manage stakeholder expectations during ad shutdowns
Why it matters: This reveals the 'Organic Floor'. If you turn off $50,000 in monthly ad spend in a region and sales only drop by $10,000, your ads were 80% cannibalistic. You were paying Meta to show ads to people who were already going to buy.
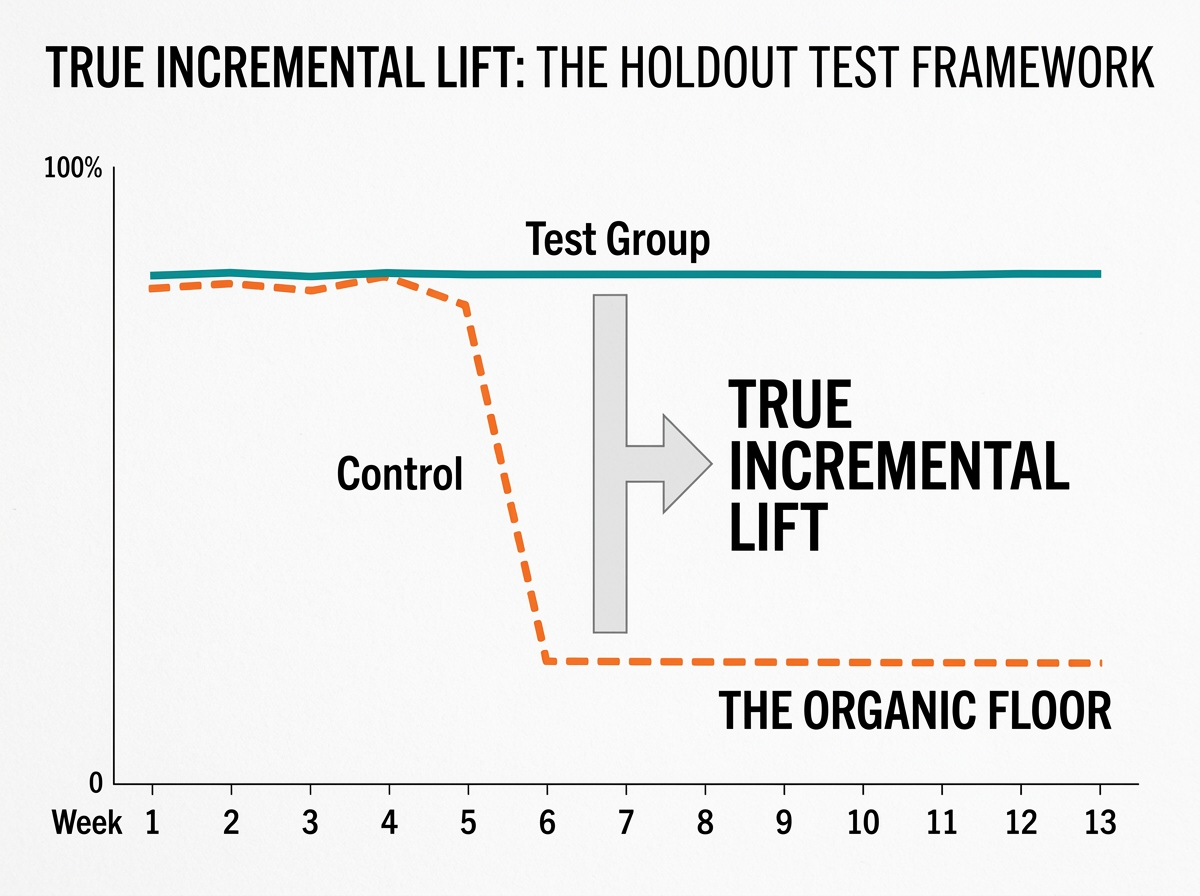
Common pitfall: Succumbing to 'Revenue Panic'. When the CEO sees a dip in total revenue in week 6, they will want to turn the ads back on. You must hold the line for the full five weeks to get clean data. Remind them that losing a small amount of revenue now saves millions in wasted spend later.
Step 4: The 4-week 'Recovery' analysis (Phase 3)
In week 10, you turn the ads back on in the Control regions. You don't just look at the sales coming back; you look at the rate of recovery. Does the revenue return to the baseline immediately, or is there a lag?
During this final month, you are calculating your Incremental Lift. The formula is:
Lift = (Test Group Sales - Control Group Sales) / Control Group Sales (adjusted for the baseline ratio calculated in Step 2).
If the Test group (Ads on) outperformed the Control group (Ads off) by 30% after adjusting for their natural size difference, then your incrementality is 30%. If your dashboard said you had a 5.0 ROAS, but your incrementality is only 30%, your true iROAS is actually 1.5.
Why it matters: This helps you re-calibrate your bidding strategies. If you know your true iROAS is lower than reported, you might realize you’ve been overbidding for 'warm' audiences (retargeting) that would have converted anyway, and under-investing in 'cold' top-of-funnel audiences that drive real growth.
Common pitfall: Ignoring other channels. If your search team ramps up Google Ads in the Control region to 'compensate' for the social drop, they have just ruined your test. All other variables must remain constant across both groups.
Step 5: Cross-referencing with platform-native tools
While your geo-holdout is the 'source of truth', you should compare these findings against Meta's native Conversion Lift Studies and TikTok’s Incrementality Testing suite.
Meta’s tool uses a randomized user-level holdout. It’s excellent for measuring the impact of specific creative or campaign types, but it can be 'leaky' due to cross-device tracking issues and ATT (App Tracking Transparency) limitations. By comparing the platform's reported lift (e.g., 'Meta says we drove 15% lift') against your 13-week geo-test (e.g., 'Our geo-test shows 12% lift'), you can develop a 'Confidence Multiplier'.
Why it matters: You can't run a 13-week geo-test every month—it’s too disruptive. But if you know that Meta’s native tool consistently overstates lift by 3%, you can apply that discount to your weekly reporting to get a more accurate picture of performance.

Common pitfall: Treating platform data as gospel. Platforms are incentivized to show that their ads work. Always use your internal first-party data (Shopify, Magento, Salesforce) as the final arbiter of truth.
Step 6: Verification and scaling
How do you know the test worked? You look for the 'Rebound Correlation'. When ads were reintroduced in week 10, did the specific product categories featured in the ads see a disproportionate rise compared to non-advertised categories? If yes, your signal is clean.
Once you have your incrementality percentage, you must apply it to your budget allocation.
- Cut the Fat: Reduce spend in campaigns with low incrementality (often bottom-of-funnel retargeting).
- Fund the Growth: Reallocate those dollars to the campaigns that showed the highest lift—usually broad-targeted, creative-heavy top-of-funnel campaigns.
- Update your MMM: If you use Marketing Mix Modeling (like Robyn or LightweightMMM), feed these holdout results back into the model to refine the coefficients for paid social.
Why it matters: Testing without action is just an academic exercise. The goal is to shift your spend to where it generates the most 'New-to-Brand' (NTB) customers.
Three tactics to try next
- The 'Branded Search' Shutdown: Run a similar 4-week holdout on your branded search terms. If your organic listing is #1, how many of those paid clicks are you just buying from yourself? Recent data suggests this is the most common area of waste.
- Creative-Level Incrementality: Use Meta’s 'Cell' testing to run two different creative concepts against a single holdout group. This tells you which vibe drives more incremental action, not just more clicks.
- Post-Purchase Attribution (PPA): Implement a 'How did you hear about us?' survey on your thank-you page (using tools like Fairing or KnoCommerce). Compare the 'survey-claimed' attribution to your holdout results. If 40% of people say 'TikTok' but your holdout shows only a 10% lift, you have a massive attribution gap to investigate.
[INTERNAL: The complete guide to post-purchase survey design -> post-purchase-attribution-guide]
By following this 13-week framework, you stop guessing and start measuring. You move from being a 'buyer' of traffic to an 'architect' of growth. In an era where LinkedIn rewards 'polished business speak' [S3] and search results are increasingly mediated by AI retrieval stacks [S1], owning your data is the only way to remain competitive.
FAQ