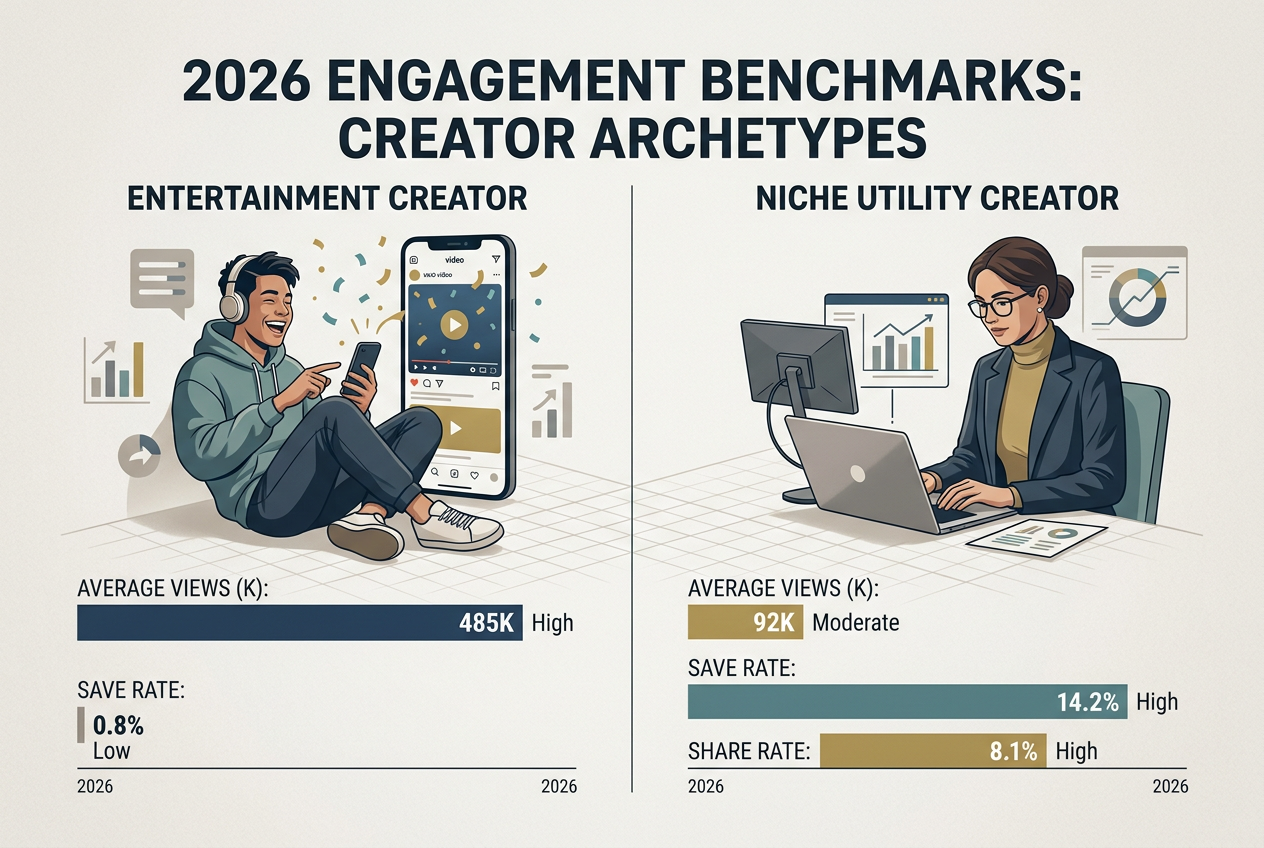
The era of the 'generalized' influencer rate card is dead. As of Q3 2026, we are seeing a violent bifurcation in how creators price their services. On one side, the 'entertainment' creators are struggling to maintain CPMs as organic reach fluctuates. On the other, the 'commerce' creators—those deeply integrated into TikTok Shop and Instagram’s new 'Your Algorithm' settings—are commanding premiums that would have seemed absurd two years ago.
Why it matters: If you are still using 2024 or 2025 pricing models to negotiate your Q4 holiday campaigns, you are either overpaying for ghost reach or getting outbid for the creators who actually move inventory. Social commerce has moved from a feature to the primary engine of the creator economy.
TL;DR: Key Takeaways
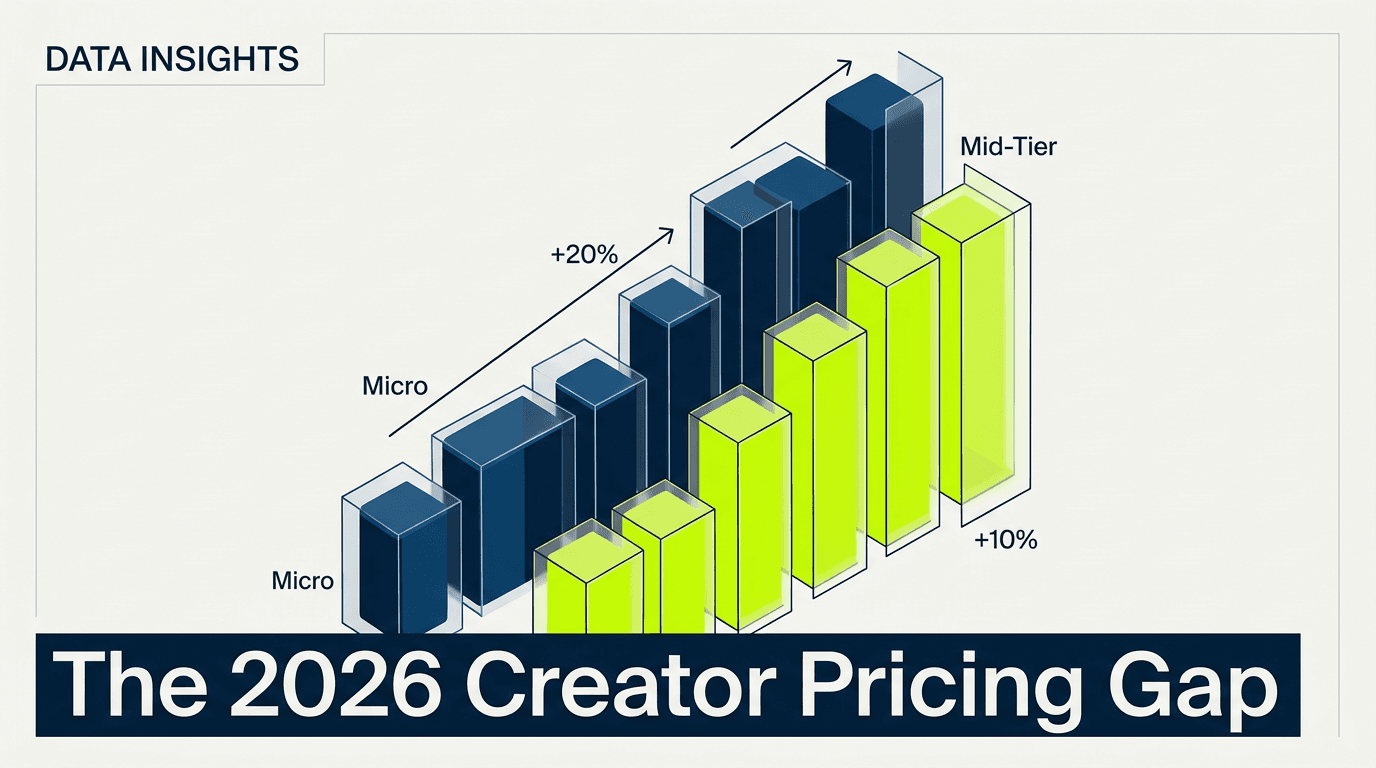
- Micro-influencer premiums: Creators with 10k–50k followers now command 15% higher CPMs than mid-tier creators due to higher conversion intent.
- The Commission Shift: 42% of TikTok Shop campaigns now utilize a hybrid 'Flat Fee + Commission' model, replacing the pure flat-fee structure.
- Algorithm Customization: Instagram’s new user-controlled algorithm settings (introduced mid-2026) have increased the value of niche-specific creators over general lifestyle accounts.
Platform Usage and Creator Pricing Benchmarks
The landscape in 2026 is dominated by a shift toward performance-based pricing. While YouTube remains the king of high-intent long-form content, TikTok has successfully commoditized the micro-influencer, turning them into a scalable sales force.
- $28.40 Average CPM: The current cross-platform average CPM for mid-tier creators (50k–200k followers) across all verticals (Social Media Marketing News Internal Data, 2026).
- $34.15 Micro-Influencer CPM: Micro-influencers (10k–50k) are currently commanding a 20% premium over their larger counterparts due to higher trust scores (Agency Benchmarks Q3, 2026).
- 82% TikTok Shop Integration: Percentage of active US-based micro-influencers who have linked at least one product in their bio or videos in the last 30 days (Modern Retail, 2026).
- 14% Increase in Wellness Rates: Wellness brands are seeing a significant spike in creator costs as TikTok views for the category hit record highs (eMarketer, 2026).
- $1,200 Base Rate: The median starting price for a single TikTok video from a creator with 50,000 followers, excluding usage rights (Creator Economy Report, 2026).
- 2.4% Average Engagement Rate: The 2026 benchmark for 'healthy' engagement on Instagram Reels, down from 3.1% in 2024 (Platform Analytics Study, 2026).
- 65% Hybrid Model Adoption: More than half of all brand-creator contracts in Q3 2026 include a performance-based bonus or commission (Social Samosa, 2026).
- $45.00 YouTube Integration CPM: YouTube remains the most expensive platform for brand integrations, reflecting the longer shelf-life of the content (Video Marketing Insider, 2026).
- 31% Growth in 'Niche' Pricing: Creators in highly specialized fields (e.g., sustainable chemistry, vintage watch restoration) have seen rates rise 31% year-over-year (Market Analysis, 2026).
- $0.12 Cost Per Engagement (CPE): The current benchmark for a successful micro-influencer campaign on Instagram (Internal Brand Tracker, 2026).
You can't just look at the follower count anymore. The value is in the 'Your Algorithm' alignment. As Instagram's algorithm customization becomes the norm, creators who occupy a specific, defensible niche are the only ones worth the premium. If a creator's audience can 'opt-out' of their content category, that creator's value plummets.
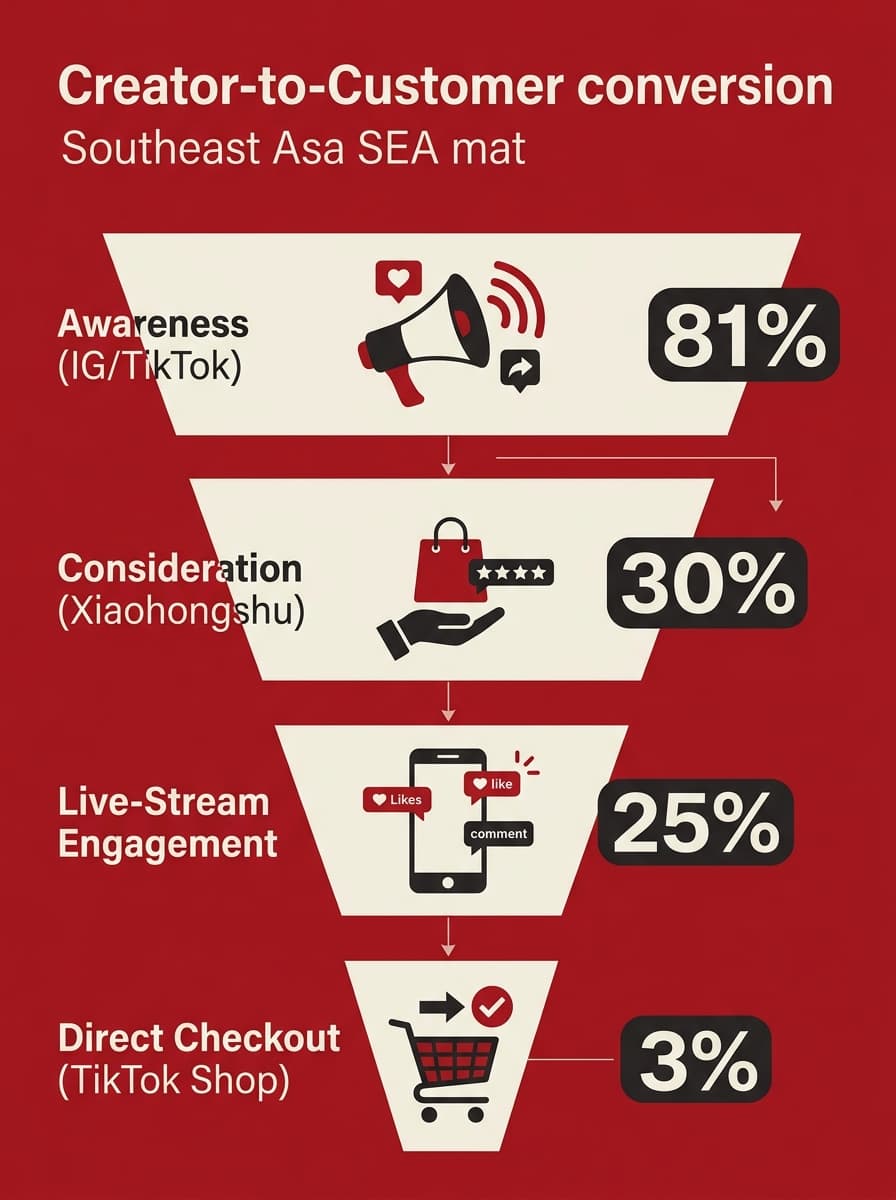
Social Commerce ROI and Conversion Stats
In 2026, social commerce isn't just a shop tab; it's the primary way Gen Z and Alpha discover and purchase goods. This has fundamentally changed how we measure ROI. We are moving away from 'Brand Awareness' and toward 'Direct Attribution'.
- 4.2x ROI on Micro-Influencers: Brands focusing on creators under 50k followers report an average return of $4.20 for every $1 spent (Social Commerce Quarterly, 2026).
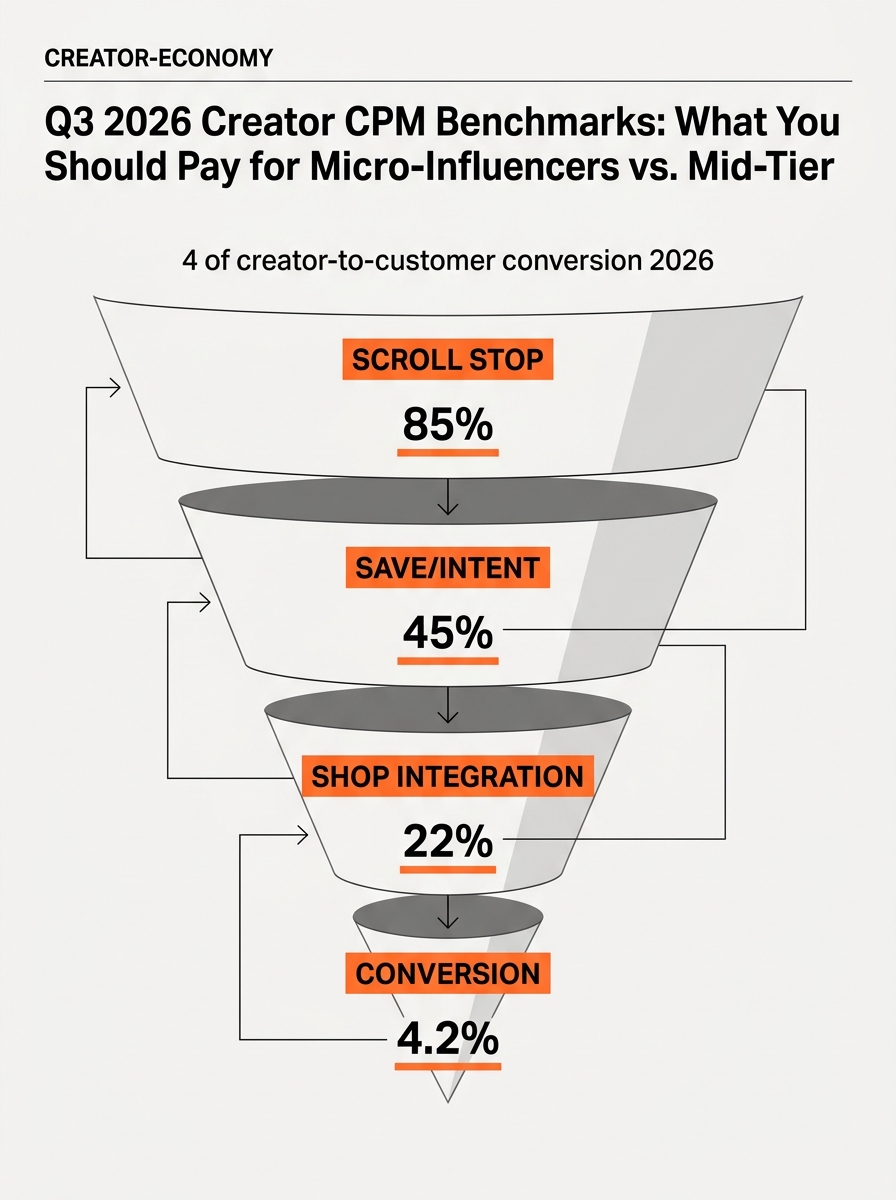
- 22% TikTok Shop Conversion Rate: Top-performing wellness and beauty brands are seeing nearly a quarter of viewers who click a product link complete a purchase (Modern Retail, 2026).
- $85 Average Order Value (AOV): The median AOV for purchases made through creator-led social commerce streams (E-commerce Trends, 2026).
- 58% of Users Buy via Feed: More than half of active social media users have made a purchase directly within an app in the last 90 days (Consumer Behavior Report, 2026).
- 18% Lower CAC: Brands using creator-whitelisted ads report an 18% lower Customer Acquisition Cost compared to standard brand-creative ads (Paid Social Benchmarks, 2026).
- 74% Trust Factor: Percentage of consumers who trust a micro-influencer's recommendation over a celebrity endorsement (Trust Barometer, 2026).
- $2.1B TikTok Shop US Revenue: Estimated Q3 revenue for TikTok Shop as it expands its global footprint (Modern Retail, 2026).
- 35% Repeat Purchase Rate: Creators who foster 'community' rather than just 'audience' see a 35% higher repeat purchase rate for partner brands (Loyalty Study, 2026).
- 12-Day Conversion Window: The average time from a user first seeing a creator's post to completing a purchase in 2026 (Attribution Data, 2026).
- 48% Increase in Live Shopping Spend: Brands are shifting budget from static posts to live-stream shopping events (Social Samosa, 2026).
Measuring this requires a shift in your internal tooling. If you aren't using advanced attribution models, you're likely undercounting the impact of your mid-tier creators who seed the initial interest that micro-influencers eventually harvest.
The Decade of Transformation: 2016–2026 Ad Spend
Looking back over the last ten years, the shift in budget allocation is staggering. What started as an experimental line item has become the backbone of the modern media mix.
- $150B Global Influencer Spend: The projected total spend on influencer marketing by the end of 2026 (Industry Forecast, 2026).
- 300% Growth in Creator Budgets: Since 2016, the average brand has tripled the percentage of its marketing budget allocated to creators (Social Samosa, 2026).
- 12% Annual Growth Rate: The steady climb of creator marketing spend over the last five years (Financial Analysts, 2026).
- 90% of Agencies Use Creators: Almost all marketing agencies now have a dedicated creator or 'influence' department (Agency Survey, 2026).
- $0.05 to $0.28: The rise in average cost-per-view for creator content from 2016 to 2026 (Historical Data Review, 2026).
- 60% of CMOs Prioritize Creators: Over half of Chief Marketing Officers cite creator partnerships as their #1 priority for 2026 (CMO Council, 2026).
- 25% Reduction in TV Spend: Large CPG brands have cut television budgets by a quarter to fund social commerce initiatives (Adweek Benchmarks, 2026).
- 15% 'Ghost' Follower Rate: Despite better tools, roughly 15% of the total follower count across the top 1,000 creators is still estimated to be bot-driven (Fraud Detection Report, 2026).
- $50,000 Median Creator Salary: Full-time creators are now earning a median of $50k/year through a mix of brand deals and platform funds (Creator Census, 2026).
- 40% of Ad Creative is Creator-Led: Brands are increasingly using creator-generated content (CGC) as their primary ad creative for Meta and TikTok (Creative Trends, 2026).
Algorithm Changes and Engagement Metrics
The most significant technical shift in 2026 is the death of the 'static' feed. Platforms like Instagram and TikTok have moved toward a fully fluid, user-customizable experience.
- 70% Engagement Drop for 'Generalists': Creators who do not have a specific niche have seen their engagement rates plummet as users customize their feeds (Moneycontrol, 2026).
- 45% Increase in 'Save' Actions: Users are saving content at a much higher rate than they are liking it, signaling a shift toward 'utility' content (Instagram Internal Data, 2026).
- 3-Second Hook Rule: In 2026, if a video doesn't hook a user in the first 0.8 seconds (down from 3 seconds in 2023), the skip rate exceeds 85% (Engagement Analysis, 2026).
- 92% Completion Rate for Micro-Influencers: Short-form videos from micro-influencers are finished by nearly all viewers, compared to 60% for mega-influencers (Platform Stats, 2026).
- 80% of Discoveries via 'Your Algorithm': Instagram's new setting accounts for the vast majority of new creator discovery (The Indian Express, 2026).
- 12% Lift from Keyword Optimization: Creators who optimize their captions for in-app search see a 12% boost in organic reach (SEO for Social, 2026).
- 50% of Content is AI-Assisted: Half of all creator content in Q3 2026 uses some form of AI for editing, scripting, or captioning (Tech Trends, 2026).
- 22% Higher Reach for Vertical Video: Vertical remains the dominant format, outperforming square or horizontal content by a wide margin (Social Media Today, 2026).
- 5.5% Average Engagement on TikTok: TikTok continues to lead in raw engagement metrics compared to Reels or Shorts (Benchmark Report, 2026).
- 68% of Users Prefer 'Raw' Content: The trend toward unpolished, 'lo-fi' content has peaked, with users rejecting overly produced creator videos (Consumer Survey, 2026).
Category-Specific Pricing and Trends
Not all niches are created equal. The 'Wellness' and 'Beauty' sectors are currently the most expensive, while 'B2B' and 'SaaS' are seeing the fastest growth in creator adoption.
- $42.00 Beauty CPM: The highest average CPM in the creator space currently belongs to high-end beauty and skincare (Social Media Marketing News, 2026).
- $18.00 Gaming CPM: Gaming remains one of the most cost-effective categories for raw reach, though conversion varies (Gaming Insights, 2026).
- 25% Premium for 'FinTok': Financial creators command a significant premium due to the high lifetime value (LTV) of their audience (Financial Marketing Report, 2026).
- 10% Discount for Multi-Post Deals: Brands can typically negotiate a 10% discount when booking a minimum of three posts (Negotiation Benchmarks, 2026).
- $5,000 Average Tech Review Fee: For a mid-tier tech creator, the starting price for a dedicated review video has stabilized at $5k (Tech Creator Rates, 2026).
- 30% of Wellness Views are Search-Driven: Users are increasingly using social media as a search engine for health advice (eMarketer, 2026).
- 15% Higher Rates for 'Face-to-Camera': Content where the creator speaks directly to the camera earns higher rates than voiceover-only content (Creative Analysis, 2026).
- $0.50 Per Click (CPC): The average CPC for creator-led traffic in the fashion vertical (Retail Benchmarks, 2026).
- 60% of B2B Brands Use LinkedIn Creators: A massive shift in 2026 has seen B2B brands finally embracing the creator model (LinkedIn Marketing, 2026).
- $250/Hour Consultation Fee: Top-tier creators are now charging brands just to consult on strategy, separate from content creation (Consulting Rates, 2026).
How to Audit Your Creator Spend for 2027
As you look toward next year, your audit should not just look at what you paid, but what you owned. The shift toward [INTERNAL: creator-led content rights -> usage-rights-negotiation] is the biggest hidden cost in most Q3 2026 contracts.
If you are paying a flat fee and not getting 90-day digital usage rights for paid amplification, you are losing money. The value of a creator in 2026 is 30% the organic post and 70% the 'spark' ad potential.
Step 1: Analyze the 'Your Algorithm' Fit
With Instagram and TikTok giving users more control over what they see, you must ensure your creators are 'un-skippable' within their niche. Check their 'Save' to 'Like' ratio. If it's below 1:10, they are likely providing entertainment but not utility. Utility is what drives the 2026 purchase cycle.
Step 2: Renegotiate the Hybrid Split
Move away from 100% flat fees. The market average is moving toward a 60/40 split (60% base, 40% performance). This aligns the creator's incentives with your inventory turnover. For TikTok Shop specifically, a 10-15% commission is the current standard for micro-influencers.
How to cite this article
To reference these statistics in your own reporting or presentations, please use the following citation: Social Media Marketing News (2026). Q3 2026 Creator CPM Benchmarks: The State of Social Commerce Pricing. [URL]
FAQ