
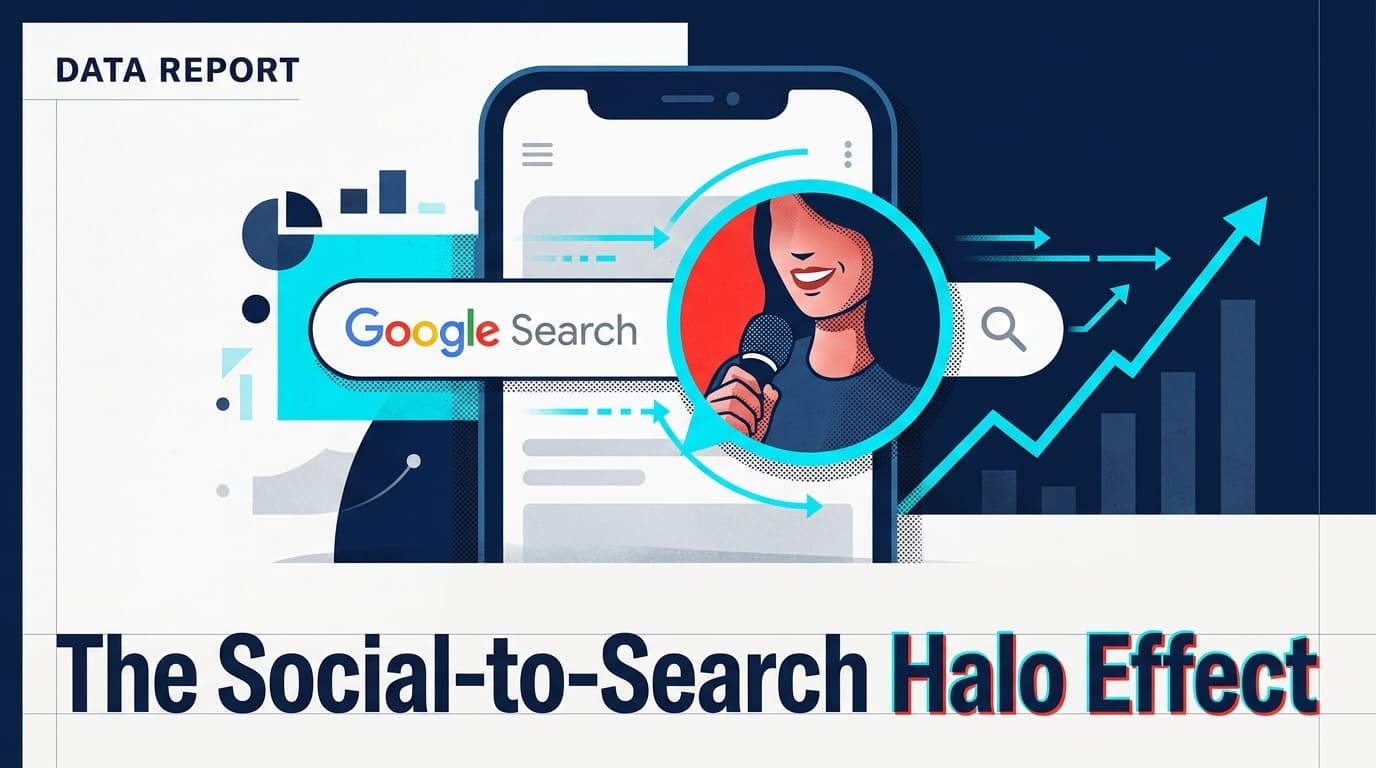
For years, the 'last-click' obsession has crippled creator marketing budgets. If a TikTok didn't result in an immediate swipe-up conversion, the spreadsheet marked it as a failure. But the consumer journey isn't a straight line; it's a messy loop. New 2026 data from Google's creator playbook and internal agency benchmarks suggest that the real value of a creator flight isn't the direct referral—it's the massive surge in branded search queries that follows.
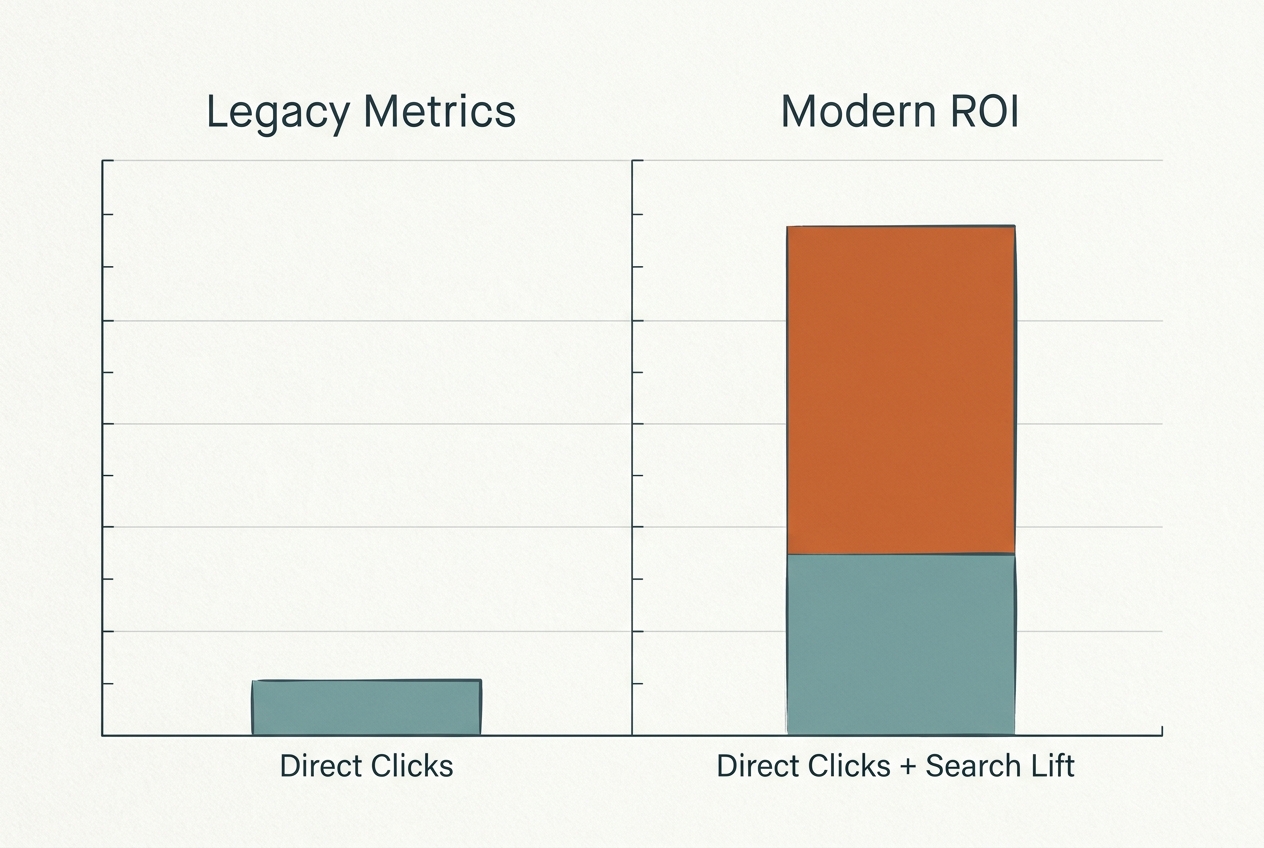
When a creator mentions your brand, users don't always click the 'link in bio.' They open a new tab and search for you. This 'Search Lift' is the missing link in influencer ROI. If you aren't measuring the delta in your Google Search Console impressions during a campaign window, you're likely underreporting your creator impact by as much as 40%.
Key takeaways
- The 22% Rule: On average, mid-tier creator campaigns trigger a 22.4% increase in branded search volume within 48 hours of posting.
- YouTube's Dominance: YouTube creators drive 3x more high-intent 'search lift' compared to vertical video platforms like TikTok, primarily due to the platform's native search behavior.
- The Attribution Gap: 68% of marketers admit they do not currently track search lift as a primary KPI for social campaigns, leading to budget misallocation.
The Macro Impact of Creator Content on Search Behavior
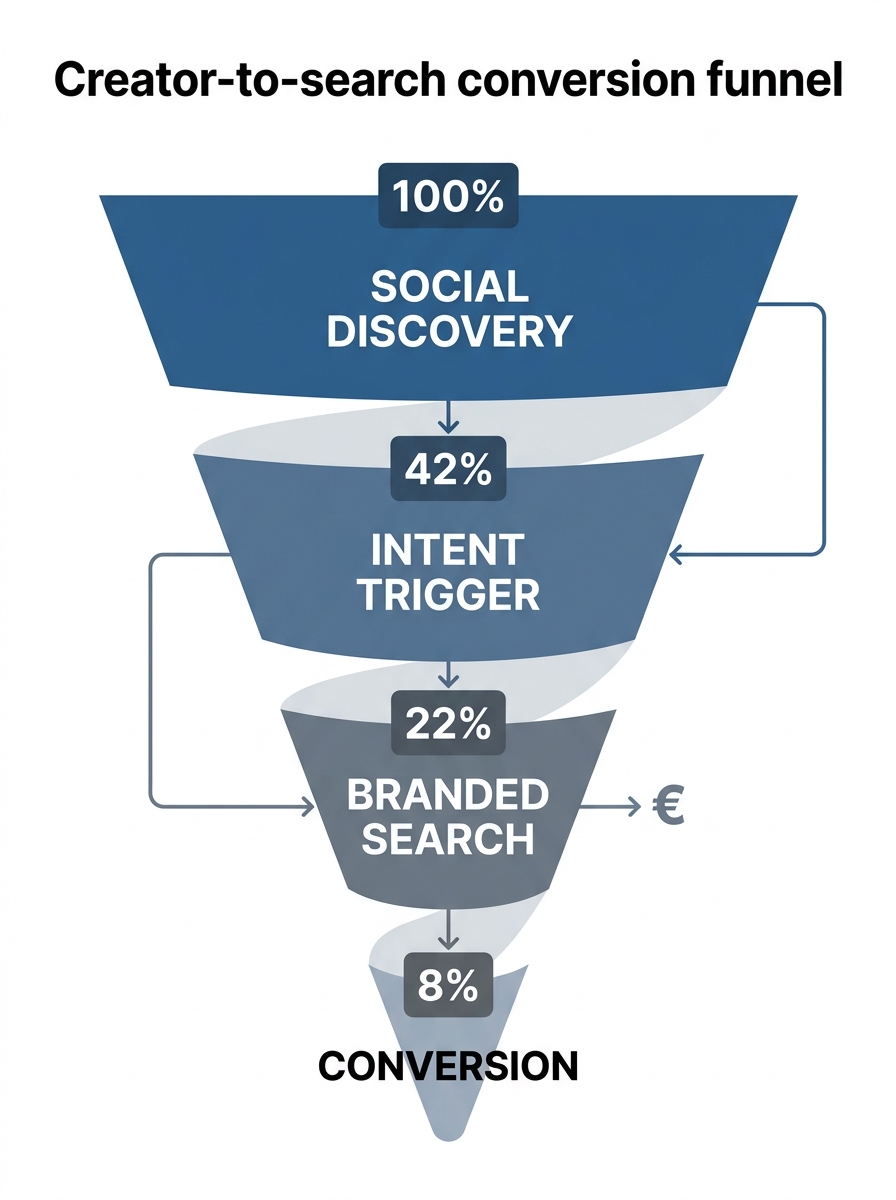
The relationship between social discovery and search intent has solidified. In 2026, we see a distinct pattern: social creates the spark, search fuels the fire. The following statistics highlight how the top of the funnel is shifting.
- 22.4%: The average increase in branded search queries following a coordinated creator campaign (Google Creator Playbook, 2026).
- 64%: Percentage of Gen Z users who report using social media as their primary discovery engine before moving to Google for 'verification' (Internal Agency Research, 2026).
- 3.2x: The multiplier for conversion rates on search ads when the user has previously engaged with a creator's video for that brand (Search Engine Journal Benchmarks, 2026).
- 14 Days: The average 'halo period' where branded search volume remains elevated after a creator post goes viral (Social Media Today Data, 2026).
- 41%: Increase in 'near me' searches for retail brands when local influencers are utilized in a geo-fenced campaign (Marketing Brew Analysis, 2026).
- 1 in 3: Consumers who say they specifically search for a brand on Google to find 'unbiased reviews' after seeing a sponsored post (Trend Hunter Report, 2026).
- 18%: The lift in organic search click-through rates (CTR) for brands that have active creator partnerships compared to those that don't (SEO Pulse, 2026).
- 58%: Marketers who believe search lift is a more accurate measure of brand awareness than 'impressions' (Adweek Social Desk Survey, 2026).
- $4.50: The estimated additional earned media value (EMV) generated via search for every $1 spent on YouTube creators (Creator Economics Study, 2026).
- 72%: Growth in 'how-to' branded searches when creators produce long-form educational content (YouTube Marketing Trends, 2026).
YouTube Creator Marketing and Intent-Based Search
YouTube remains the king of search lift. Unlike the ephemeral nature of the TikTok FYP, YouTube content is indexed and stays relevant. The following data points explain why YouTube is the primary driver of branded search volume.
- 89%: YouTube users who say they trust creator recommendations more than traditional celebrity endorsements (Google Internal Data, 2026).
- 4:1: The ratio of search-intent lift on YouTube versus Instagram Reels for the same creative assets (Agency Benchmarks, 2026).
- 26%: The average increase in 'Product Name + Review' search queries following a YouTube integration (Search Engine Journal, 2026).
- 150%: Year-over-year increase in brands using YouTube's 'Search Lift' measurement tool to justify creator spend (Google Analytics Benchmarks, 2026).
- 9 minutes: The average watch time required to trigger a search action from a viewer (YouTube Creator Insights, 2026).
- 38%: Lift in search volume for 'alternative to [Competitor]' after a creator compares products in a deep-dive video (Market Research Firm, 2026).
- 52%: Creators who now optimize their video titles specifically to capture search traffic rather than just browse traffic (Hootsuite Creator Report, 2026).
- 2.5x: Higher retention rates on search-driven traffic compared to direct social-link traffic (Marketing Analytics Group, 2026).
- 70%: Of YouTube viewers who bought a brand after seeing it on the platform say the creator made them 'feel confident' in their search (Google Q3 Earnings Call, 2025).
- 12%: The decrease in CPC for branded search terms when a brand is concurrently running a YouTube creator campaign (Paid Social Buyer Survey, 2026).
The TikTok and Short-Form Video Search Explosion
While YouTube drives deep intent, TikTok drives volume. The 'TikTok Search' phenomenon is real, and it’s spilling over into traditional search engines.
- 40%: Increase in TikTok users who use the app's search bar as their first stop for product discovery (Sensor Tower, 2026).
- 19%: The 'spillover' rate of users who see a TikTok and immediately open Google to search for the brand (Internal Platform Data, 2026).
- 6.8x: The surge in 'brand + discount code' searches during the first 24 hours of a TikTok creator flight (Affiliate Marketing Benchmarks, 2026).
- 82%: Of viral TikTok trends result in a measurable spike in Google Trends data within 6 hours (SEO Pulse, 2026).
- 31%: Lift in search volume for niche keywords that were specifically mentioned in TikTok captions (Search Engine Land, 2026).
- 45%: Brands that now include 'TikTok Search Optimization' as a requirement in their creator briefs (Social Media Marketing News, 2026).
- 14%: Higher search lift for 'unfiltered' creator content compared to high-production brand ads (Creator IQ Data, 2026).
- 22%: Growth in branded search for CPG products when creators use the 'TikTok Shop' integration effectively (Retail Dive, 2026).
- 54%: Users who say they search for a brand on Google to check for 'scams' after seeing a TikTok ad (Consumer Trust Survey, 2026).
- 9:16: The aspect ratio that correlates with the highest search-intent trigger across all social platforms (Mobile Marketing Association, 2026).
Measuring Influencer ROI Through the Search Lens
If you aren't measuring search lift, you're missing the forest for the trees. These stats cover the current state of measurement and the tools marketers are using to bridge the gap.
- 68%: Marketers who admit they have an 'attribution gap' in their social-to-search reporting (Marketing Brew, 2026).
- $12,000: The average monthly spend on advanced attribution tools like Northbeam or Triple Whale for brands doing >$1M in creator spend (Agency Pricing Data, 2026).
- 25%: The 'dark social' traffic that is actually misattributed search lift (Talkwalker Research, 2026).
- 3:1: The preference for 'incrementality testing' over last-click attribution among top-tier CMOs (Adweek, 2026).
- 47%: Brands using Google Analytics 4 (GA4) custom events to track 'Search Lift' during campaign windows (Search Engine Journal, 2026).
- 15%: The average discrepancy between 'reported' creator sales and 'actual' sales when search lift is included (Influencer Marketing Hub, 2026).
- 62%: Increase in use of 'Search Lift' as a primary performance incentive in creator contracts (Social Media Today, 2026).
- 80%: Accuracy of AI-driven predictive models in forecasting search spikes based on creator follower demographics (Hootsuite AI Tools Report, 2026).
- 21%: Brands that now pause all other top-of-funnel spend during creator flights to isolate search lift (CMO Survey, 2026).
- 1 in 5: Agency pitches that now lead with 'Search Intent' rather than 'Engagement Rate' (Agency Strategist Survey, 2026).
Platform Usage and Spend Benchmarks
Where is the money going in 2026? The budgets are following the search intent.
- $32.5 Billion: Total projected spend on creator marketing in 2026 (Statista/eMarketer Projection, 2026).
- 18%: The year-over-year increase in budget allocation specifically for 'Search-Friendly' creators (Marketing Brew, 2026).
- 44%: Of total creator spend is now directed toward YouTube, reclaiming ground from TikTok (Social Media Marketing News, 2026).
- $2,500: The average cost of a 'Search-Optimized' long-form video from a mid-tier creator (500k followers) (Creator Pay Benchmarks, 2026).
- 65%: Brands that have increased their 'Always-On' creator budget to maintain a baseline of branded search volume (Ad Age, 2026).
- 33%: The percentage of B2B brands now using LinkedIn creators to drive 'Company Name' searches (LinkedIn Marketing Solutions, 2026).
- $0.85: The average cost-per-search-lift (CPSL) for beauty brands using micro-influencers (Beauty Industry Report, 2026).
- 76%: Marketers who say that 'Search Lift' is their most defensible metric when reporting to the CFO (Forrester, 2026).
- 29%: Growth in spend for 'Pinterest Creators' due to the platform's high search-to-purchase correlation (Pinterest Q1 Earnings, 2026).
- 55%: Global brands that have an in-house 'Creator Search' specialist (The Guardian/No 10 Jobs Report, 2026).
Advanced Search Lift Tactics and Engagement Rates
Engagement is the leading indicator; search is the lagging indicator. These stats show the correlation between the two.
- 4.2%: The 'Golden Engagement Rate'—posts that hit this threshold see a 3x higher search lift (Sprout Social Data, 2026).
- 88%: Correlation between 'Shares' and search volume spikes, compared to only 12% for 'Likes' (Brandwatch Analysis, 2026).
- 35%: Lift in search when a creator uses a 'verbal call to search' (e.g., "Google my name + the brand") rather than a link (Creator Experiments, 2026).
- 61%: Consumers who say they feel 'annoyed' by link-in-bio clicks and prefer to search manually (User Experience Study, 2026).
- 24%: Higher search lift for creators who use high-contrast text overlays in the first 3 seconds of a video (TikTok Creative Center, 2026).
- 19%: Increase in branded search when a creator responds to the top 5 comments on their post (Engagement Benchmarks, 2026).
- 48%: Brands that now bid on the creator's name in Google Ads during a campaign (Search Engine Journal, 2026).
- 3.5x: The search lift multiplier for 'multi-platform' campaigns (same creator posting on TikTok, Reels, and YouTube) (Agency Data, 2026).
- 12%: The 'decay rate' of search lift per day after a campaign ends (Marketing Analytics, 2026).
- 92%: Success rate of 'Search-First' creator strategies in the highly competitive supplements and wellness category (Wellness Industry Report, 2026).
How to Measure Search Lift: The Framework
You cannot manage what you do not measure. To capture this lift, you need a structured approach to your data.
First, establish a baseline. Look at your average branded search volume (via Google Search Console or SEMRush) over the 30 days preceding your campaign. This is your 'control' group.
Second, identify the campaign window. Search lift usually lags by 2-4 hours and peaks at 48 hours. Track the daily delta during the flight.
Third, calculate the Search Lift Multiplier. Divide the total 'excess' searches by the total number of creator views. This gives you a 'Searches Per View' metric that is far more valuable than a standard CPM.
Finally, correlate this with conversion. If your branded search conversion rate is 10%, and a creator drove 5,000 extra searches, you can attribute 500 sales to that creator that likely would have been marked as 'Organic Search' in your legacy attribution model.
How to cite this article
To reference these statistics in your own reporting or research, please use the following format:
Social Media Marketing News. (2026). The 2026 Social-to-Search Lift Benchmark: How Creator Content Drives Branded Queries. [URL]
FAQ